
- Resource Library
- Math
- Probability And Statistics
- Measures Of Center
- Using Measures Of Center To Draw Inferences
Using Measures of Center to Draw Inferences
Presentation
•
Mathematics
•
7th Grade
•
Practice Problem
•
Medium
+7
Standards-aligned
Befaney Roberson
Used 56+ times
FREE Resource
3 Slides • 18 Questions
1
Using Measures of Center to Draw Inferences
MGSE7.SP.4 Use measures of center and measures of variability for numerical data from random samples to draw informal comparative inferences about two populations.
2
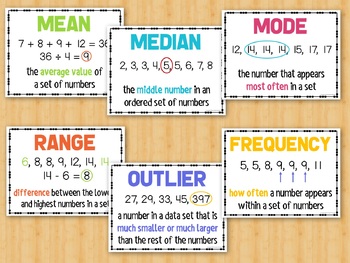
Review the Measures of Center
Mean, Median, Mode, ...( Range and Outlier)
3
4
Multiple Choice
Which measures are affected by the outlier? (you need to find the mean, median, and mode without the outlier to answer this)
mean
mean and median
mean, median, and mode
median
5
Multiple Choice
Jaiden scored 71, 80, and 86 on his first three Radicals tests. What must Jaiden score on the fourth test to have a mean of exactly 80?
80
83
85
88
6
Multiple Choice
Gizeth’s test scores are 86, 70, 72, 100, 96, and 80. Which score must Gizeth earn on her next test to have a mean grade of exactly 85?
91
88
85
84
7
Multiple Choice
Mohammed’s current grades for his Delta Math assignments in Alg 1 class are 85, 90, 95, and 80. What is his average on all of these assignments?
80.3
83
88
80.8
8
Multiple Choice
9
Multiple Choice
10
Multiple Choice
11
Multiple Choice
12
Multiple Choice
13
Multiple Choice
14
Multiple Choice
Compare the data sets to draw an accurate conclusion.
DVD players cost less, on average, at Store B
The range for Store B is greater than the range for store A
Data for store B has a greater mean, but not greater median than Store A.
DVD players cost less, on average, at Store A.
15
Multiple Choice
The Table above shows the points scored by the 7th grade basketball team from the previous season. What is the mean, median and mode of the data set?
Mean: 28
Median: 26
Mode: 20
Mean: 27
Median: 26
Mode: 20
Mean: 25
Median: 28
Mode: None
Mean: 28
Median: 28
Mode: 20
16
Multiple Choice
The dot plots show how long it took students in Mr. Chauncey's two science classes to finish their science homework last night. Find the average to make an inference about the data.
The 1st period mean is 35. The 2nd period mean is 38.75. On average, it took students in the 1st period class slightly longer to finish their homework than it did the students in the 2nd period class.
The 1st period mean is 38.75. The 2nd period mean is 35. On average, it took students in the 1st period class slightly longer to finish their homework than it did the students in the 2nd period class.
The 1st period mean is 35. The 2nd period mean is 38.75. On average, it took students in the 2nd period class slightly longer to finish their homework than it did the students in the 1st period class.
The 1st period mean is 38.75. The 2nd period mean is 35. On average, it took students in the 2nd period class slightly longer to finish their homework than it did the students in the 1st period class.
17
Multiple Choice
18
Multiple Choice
19
Multiple Choice
20
Multiple Choice
2, 57, 38, 42, 6
21
Multiple Choice
12,10,10,10,13,12,11,13,10
Using Measures of Center to Draw Inferences
MGSE7.SP.4 Use measures of center and measures of variability for numerical data from random samples to draw informal comparative inferences about two populations.
Show answer
Auto Play
Slide 1 / 21
SLIDE
Similar Resources on Wayground
18 questions
Properties of Operations
Presentation
•
7th Grade
16 questions
Distributing a Negative
Presentation
•
7th Grade
16 questions
Review One and two-step equations
Presentation
•
7th Grade
17 questions
Bar graphs
Presentation
•
7th Grade
17 questions
Solving One Step Equations (Mulitplying/Dividing)
Presentation
•
7th Grade
15 questions
Circles
Presentation
•
7th Grade
18 questions
CIRCLES - radius, diameter, circumference, area
Presentation
•
7th Grade
18 questions
7th Grade Review - Geometry
Presentation
•
7th Grade
Popular Resources on Wayground
20 questions
STAAR Review Quiz #3
Quiz
•
8th Grade
20 questions
Equivalent Fractions
Quiz
•
3rd Grade
6 questions
Marshmallow Farm Quiz
Quiz
•
2nd - 5th Grade
20 questions
Main Idea and Details
Quiz
•
5th Grade
20 questions
Context Clues
Quiz
•
6th Grade
20 questions
Inferences
Quiz
•
4th Grade
19 questions
Classifying Quadrilaterals
Quiz
•
3rd Grade
12 questions
What makes Nebraska's government unique?
Quiz
•
4th - 5th Grade
Discover more resources for Mathematics
10 questions
Box Plots
Quiz
•
6th - 7th Grade
14 questions
Volume of rectangular prisms
Quiz
•
7th Grade
22 questions
Simple Probability
Quiz
•
7th Grade
20 questions
Graphing Inequalities on a Number Line
Quiz
•
6th - 9th Grade
15 questions
Simple Probability
Quiz
•
7th Grade
10 questions
Pythagorean Theorem and its Converse
Quiz
•
7th - 9th Grade
20 questions
Theoretical and Experimental Probability
Quiz
•
7th Grade
12 questions
Simple Probability
Quiz
•
7th Grade