- Resource Library
- Math
- Percents, Ratios, And Rates
- Proportional Relationships
- Unit 3: Lesson 2 : Graphs Of Proportional Relationships

Unit 3: Lesson 2 : Graphs of Proportional Relationships
Presentation
•
Mathematics
•
8th Grade
•
Practice Problem
•
Easy
•
CCSS
8.F.B.4, HSF-LE.A.1B, HSF.LE.A.2
Standards-aligned

Ja'naisa Harris
Used 13+ times
FREE Resource
13 Slides • 2 Questions
1
Unit 3: Lesson 2 : Graphs of Proportional Relationships
2
3
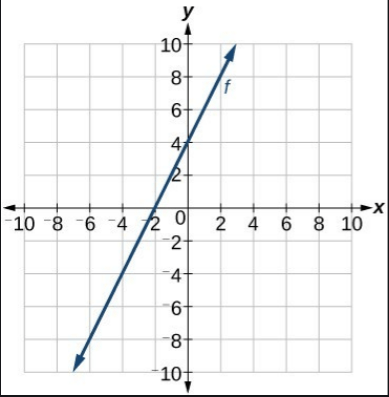
Open Ended

Warm-Up: Write an equation for this graph.
4
5
6

7

8
9
10
Graph 1

11
Graph 2

12
13
14
Poll

Cool Down: Which one of these relationships is different than the other three?
15
Unit 3: Lesson 2 : Graphs of Proportional Relationships
Show answer
Auto Play
Slide 1 / 15
SLIDE
