Search Header Logo
  1. Resource Library
  2. Math
  3. Probability And Statistics
  4. Five Number Summary
  5. 5 Number Summary And Box Plot
5 Number Summary and Box Plot

5 Number Summary and Box Plot

Assessment

Presentation

Mathematics

12th Grade

Practice Problem

Medium

CCSS
6.SP.B.4, 6.SP.A.3, 6.SP.B.5C

+2

Standards-aligned

Created by

Blake Emerton

Used 98+ times

FREE Resource

5 Slides • 17 Questions

1

5 Number Summary and Box Plot

media

2

media

3

Multiple Choice

What can we use to measure spread?

1

Mean

2

Range

3

Median

4

Mode

4

Multiple Select

What can we use to measure central tendency?

1

Median

2

Mean

3

Range

5

Multiple Choice

Find the mean:
28, 18, 19, 18, 17
1
20
2
18
3
11
4
19

6

Multiple Choice

What symbol do we use for mean?

1

xy\sum_x^y

2

x\left|x\right|

3

4

π\pi

7

media

8

media

9

Multiple Choice

Which of the following lists all parts of the five number summary?

1

A. Mean, Median, Mode, Range, and Total

2

B. Minimum, Lower Quartile, Median, Upper Quartile, and Maximum

3

C. Smallest, Q1, Q2, Q3, and Q4

4

D. Lower Quartile, Upper Quartile, Range, Mean, and Median

10

Multiple Choice

What is a graphic way of showing a summary of data using the median, quartiles, and extremes of the data?

1

A. Stem-and-Leaf Plot

2

B. Bar Graph

3

C. Box Plot

4

D. Pie Chart

11

Multiple Choice

Question image
What is the median of the data?
1
A. 200
2
B. 100
3
C. 90
4
D. 140

12

Multiple Choice

Question image
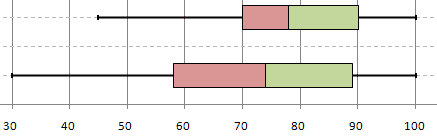
Which box and whisker plot has the highest median?
1
A. Top plot
2
B. Bottom plot

13

Multiple Choice

Question image

What data value is the upper quartile (Q3)?

1

A. 64

2

B. 61

3

C. 66

4

D. 58

14

Multiple Choice

Question image

What is the difference, or range, between the maximum and the minimum values?

1

A. 8

2

B. 7

3

C. 6

4

D. 5

15

Multiple Choice

Question image

What is the minimum value?

1

A. 64

2

B. 58

3

C. 66

4

D. 60

16

Multiple Choice

Question image
11. What percentage of the data is between 90 and 140?
1
25 %
2
50%
3
75%
4
100%

17

Multiple Choice

Question image
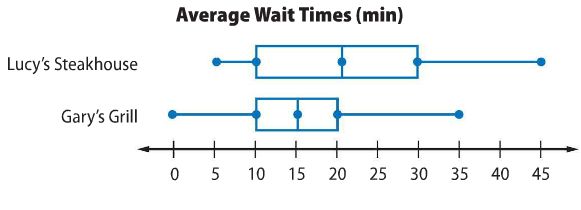
Which restaurant has a higher median wait time?
1
Lucy's Steakhouse
2
Gary's Grill
3
They are the same

18

media
media

19

Multiple Choice

Question image
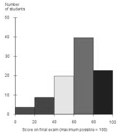
Describe the shape of the graph.
1
Skewed right
2
Skewed left
3
Uniform
4
Symmetrical

20

Multiple Choice

Question image
Describe the histogram:
1
Left Skewed
2
Normal/Symmetrical
3
Right Skewed
4
Uniform/Flat

21

Multiple Choice

Question image
Is the Cars dot plot skewed left or right?
1
left
2
right

22

Multiple Choice

Question image

What is the shape of this data?

1

symmetric

2

skewed right

3

skewed left

4

uniform

5 Number Summary and Box Plot

media

Show answer

Auto Play

Slide 1 / 22

SLIDE