
Correlation Coefficient
Presentation
•
Mathematics
•
9th Grade
•
Practice Problem
•
Medium
+2
Standards-aligned

Blake Emerton
Used 136+ times
FREE Resource
9 Slides • 16 Questions
1
Correlation Coefficient

2
Correlation tests for a relationship between two variables. However, seeing two variables moving together does not necessarily mean we know whether one variable causes the other to occur. This is why we commonly say “correlation does not imply causation.”

3
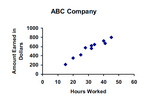
Study Time and Grades
As study hours increase, grades increase. There is a positive correlation between hours and grades.
So....Do hours spent studying cause higher grades?

4
Ice Cream Sales and Shark Attacks
As ice cream sales increase, shark attacks increase. As ice cream sales decrease, shark attacks decrease.
So....ice cream sales cause shark attacks?

5
5G and COVID cases
There is a correlation between areas with 5G and high COVID cases.
So......Does 5G cause COVID?

6
Multiple Choice
7
Multiple Choice
8
Multiple Choice
9
Multiple Choice
10
Multiple Choice
11

12
Multiple Choice

13
Multiple Choice
14
Multiple Choice

15
Multiple Choice

Which scatter plot shows a linear relationship between x and y?
16
17
Multiple Choice
Estimate the correlation coefficient for this scatterplot.
18
Multiple Choice

Describe the correlation in the graph shown.
19
Multiple Choice
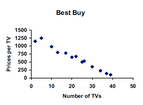
Estimate the correlation coefficient for this scatterplot.
20
Multiple Choice
21
Multiple Choice
22
Multiple Choice
23
Multiple Choice
24
Formula for Correlation Coefficient (r)
Luckily we can use our calculator!!

25
Find the correlation coefficient of the data.
Strong or weak?
Positive or negative?

Correlation Coefficient
Show answer
Auto Play
Slide 1 / 25
SLIDE
