Search Header Logo
Population ecology

Population ecology

Assessment

Presentation

•

Biology

•

10th Grade - University

•

Practice Problem

•

Medium

•
NGSS
MS-LS2-1, MS-ESS3-4, HS-LS2-2

+2

Standards-aligned

Created by

Sondi Hoffman

Used 50+ times

FREE Resource

19 Slides • 11 Questions

1

media

2

media

3

media

4

media

5

media

6

Multiple Choice

Food, water, sunlight, shelter, and space are resources that are often __________.
1
limiting factors
2
wet
3
messy
4
found in rocks

7

Multiple Choice

the pattern or spread of people in a given area

1

census

2

death rate

3

population distribution

4

demographics

8

media

9

media

10

media

11

media

12

Multiple Choice

Survivorship curve represented by high death rates for the young, then a slower death rate for survivors, good examples are fish and frogs.

1

type I

2

type II

3

type III

4

type IV

13

Multiple Choice

Survivorship curve represented by a death rate that is constant over organism’s life span, squirrels and songbirds are good examples.

1

type I

2

type II

3

type III

4

type IV

14

Multiple Choice

Question image

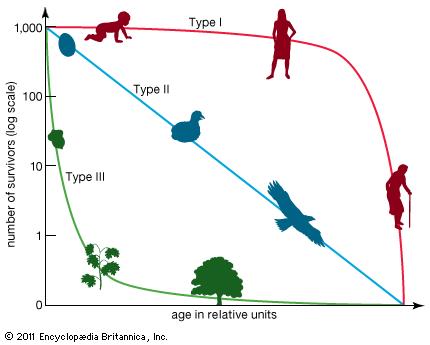
The mortality rate of organisms following a type I survivorship curve is __________.

1

fairly constant throughout life

2

higher in post-reproductive years

3

lower after the organisms become established

4

unrelated to age

15

media

16

media

17

media

18

media

19

media

20

media

21

Multiple Choice

Question image

What is happening at the 'A' on the graph?

1

the population overshoots above the carrying capacity

2

the population stops growing

3

growth begins to slow down due to limited resources

4

growth is speeding up due to an abundance of resources

22

Multiple Choice

The carrying capacity of an environment for a particular species at a particular time is determined by the
1
number of individuals in the species.
2
distribution of the population.
3
reproductive potential of the species.
4
supply of the most limited resources

23

Multiple Choice

Question image
What is the carrying capacity of the following graph?
1
1000
2
8000
3
800
4
600

24

Multiple Choice

Which limiting factor would increase due to the number of individuals in a population?
1
Unusual weather
2
Natural disaster
3
Births
4
Disease

25

media

26

media

27

media

28

media

29

Multiple Choice

As a population of a species increases within a territory, which of the following most likely also increases?

1

Immigration

2

Food supply

3

Carrying capacity

4

Competition

30

Multiple Choice

Question image

Animals such as pandas are long lived, mature slowly, and generally produce fewer offspring during their life spans but place a greater investment in each. What term is applied to this type of reproductive strategy?

1

K-strategy

2

r-strategy

media

Show answer

Auto Play

Slide 1 / 30

SLIDE