Search Header Logo
  1. Resource Library
  2. Math
  3. Data And Graphing
  4. ...
  5. 3 5 Scatter Plots
3-5 Scatter Plots

3-5 Scatter Plots

Assessment

Presentation

Mathematics

6th - 8th Grade

Hard

CCSS
HSS.ID.B.6, HSF-LE.A.1B, 8.F.A.3

+5

Standards-aligned

Created by

Stephanie Seifred

Used 11+ times

FREE Resource

1 Slide • 11 Questions

1

3-5 Scatter Plots

Slide image

2

Multiple Choice

Question image
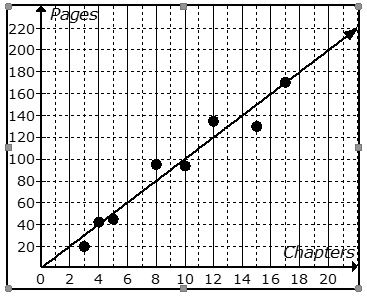
The scatter plot shows the relationship between the number of chapters and the total number of pages for several books.  Use the trend line to predict how many chapters would be in a book with 140 pages. 
1
12 chapters
2
19 chapters
3
14 chapters
4
21 chapters

3

Multiple Choice

Question image
A small theme park is trying to determine the number of guests they should expect on a weekend, based on the temperature outside.  Based on the trend line, about how many guests should be expected if the temperature is around 80°?
1
8,300
2
8
3
7,300
4
9,300

4

Multiple Choice

Question image

What type of association does this scatter plot show?

1

positive linear association

2

negative linear association

3

no association

4

nonlinear association

5

Multiple Choice

Question image
Which scatter plot shows a linear relationship between x and y?
1
Graph A
2
Graph B
3
Graph C
4
Graph D

6

Multiple Choice

Which of the following situations describes a negative correlation?
1
the amount of gas left in a car's tank and the amount used from it
2
the number of gallons purchased and the amount paid for it
3
the size of a car's gas tank and the number of gallons it holds
4
the number of miles driven and the amount of gas used

7

Multiple Choice

Question image

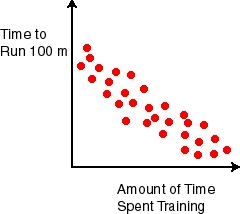
Which relationship could be represented by this scatter plot?

1

As the number of muffins in a box increases, the price increases.

2

As the speed of a car increases, the distance the car travels increases.

3

As the population of a city increases, the number of schools in the

city increases.

4

As the number of daylight hours increases, the number of night hours decreases.

8

Multiple Choice

Question image
The following scatter plot shows Pam's training as she prepares to run a 6 mile race at the end of the month.  Which of the following would be a reasonable approximation for the length of time it would take for her to run 6 miles? 
1
A. 50 min
2
B. 80 min
3
C. 45 min
4
D. 60 min

9

Multiple Choice

Question image
What type of correlation does this graph have?
1
positive
2
negative
3
none
4
all of the above

10

Multiple Choice

Question image
What type of association (correlation) does this graph have?
1
positive 
2
negative
3
none
4
all of the above

11

Multiple Choice

Question image
What type of association does this scatter plot represent?
1
positive linear association
2
negative linear association
3
no association
4
nonlinear association

12

Multiple Choice

Question image
Which sentence describes the relationship shown on this scatter plot?
1
As the temperature decreases, the visitors increase. 
2
As the temperature increases, the number of visitors increases. 
3
As the visitors increase, the temperature decreases. 
4
No correlation

3-5 Scatter Plots

Slide image

Show answer

Auto Play

Slide 1 / 12

SLIDE