
Representing Data
Presentation
•
Mathematics
•
6th - 10th Grade
•
Medium
•
CCSS
3.MD.B.3, 2.MD.D.10, 8.SP.A.1
+1
Standards-aligned

Roan Dinsdale
Used 152+ times
FREE Resource
5 Slides • 9 Questions
1
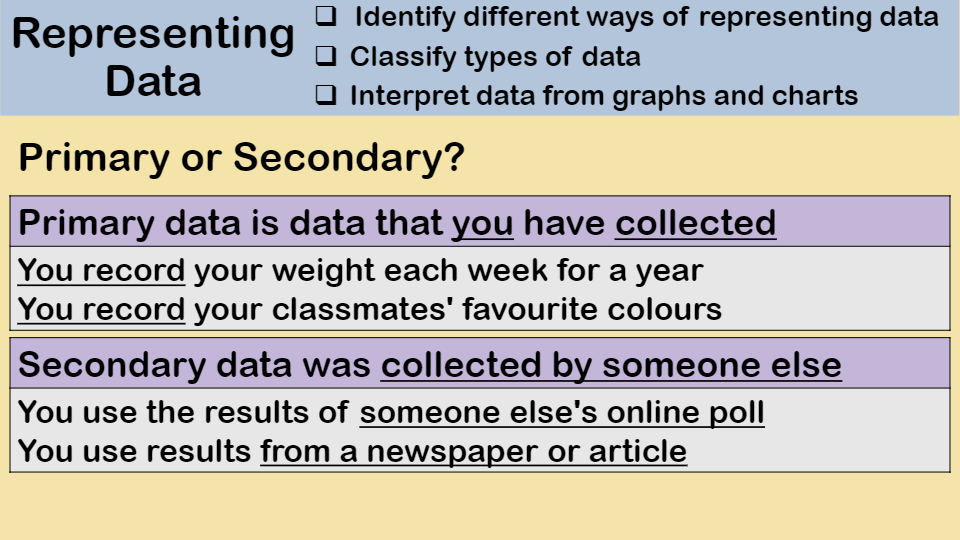
Representing Data
Identify different ways of representing data
Classify types of data
Interpret data from graphs and charts

2
Multiple Choice
3
Multiple Choice
4
Multiple Choice
5
Multiple Choice
6
Multiple Choice
7
Multiple Choice
8

9
10
Multiple Select
11
12
Multiple Select
13

14
Multiple Select
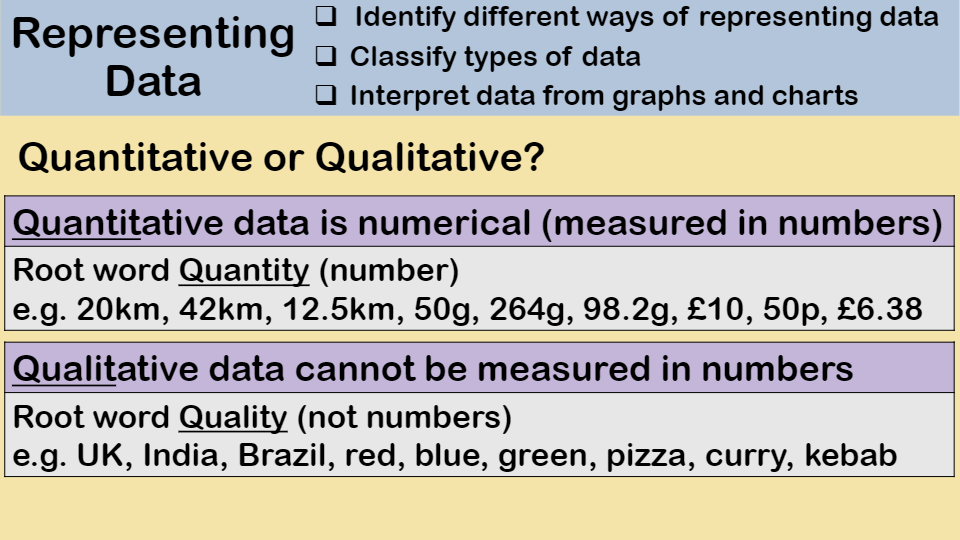
Representing Data
Identify different ways of representing data
Classify types of data
Interpret data from graphs and charts
Show answer
Auto Play
Slide 1 / 14
SLIDE
