Search Header Logo
Analyzing Physics Graphs

Analyzing Physics Graphs

Assessment

Presentation

•

Science

•

8th Grade

•

Practice Problem

•

Easy

•
CCSS.8.EE.B.5, CCSS.HSF.IF.B.4, NGSS.MS-PS3-1

+4

Standards-aligned

Used 10+ times

FREE Resource

3 Slides • 29 Questions

1

Analyzing Physics Graphs

Slide image

2

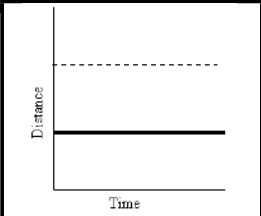
If DISTANCE is on the y-axis.....

  • You're looking at HOW FAR something has moved over time

  • It will show you how fast something has moved

Slide image

3

Multiple Choice

Question image

Calculate Albert's average speed for the 100-meter race.

1

8.33 m/s

2

5 m/s

3

7.14 m/s

4

5.88 m/s

4

Multiple Choice

Question image

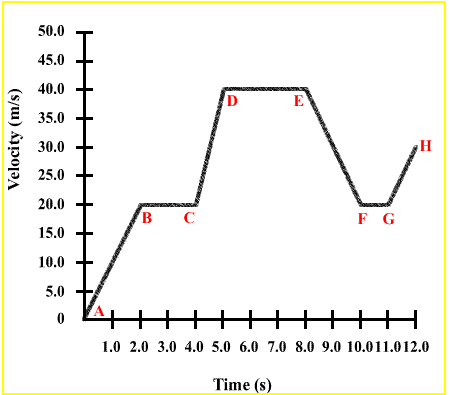
Segment E-F The bus is _________________.

1

at rest

2

returning (to original position)

3

moving forward

5

Multiple Choice

Question image

Segment D-E The bus is _________________.

1

at rest

2

returning (to original position)

3

moving forward

6

Multiple Choice

Question image

Segment C-D The bus is _________________.

1

at rest

2

returning (to original position)

3

moving forward

7

Multiple Choice

Question image

Segment B-C The bus is _________________.

1

at rest

2

returning (to original position)

3

moving forward

8

Multiple Choice

Question image

Segment A-B The bus is _________________.

1

at rest

2

returning (to original position)

3

moving forward

9

Multiple Choice

In which of the following graphs below are both runners moving at the same speed?

1
2
3
4

10

Multiple Choice

What two measurements are necessary for calculating speed?
1
Mass and time
2
Temperature and mass
3
Mass and distance
4
Distance and time

11

Multiple Choice

Question image
Which runner had a head start?
1
A
2
B
3
C

12

Multiple Choice

Question image
What is happening at C?
1
Stationary
2
Accelerating
3
Fast steady speed; moving away from the starting position
4
Slower steady speed; moving away from the starting position

13

Multiple Choice

Question image
What is happening at D?
1
Stationary
2
Accelerating
3
Fast steady speed; moving away from the starting position
4
Slower steady speed; moving away from the starting position

14

Multiple Choice

Question image
Where is the object not moving
1
A-B
2
O-A
3
C-D
4
B-C

15

Multiple Choice

Match the description to the graph:

"The car is slowing down."

1
2
3
4

16

Multiple Choice

Match the description to the graph:

"The car is traveling at a constant speed."

1
2
3
4

17

Multiple Choice

Match the description to the graph:

"The car is coming back."

1
2
3
4

18

Multiple Choice

Question image
What does this graph represent?
1
Constant speed
2
Acceleration
3
Not moving

19

Multiple Choice

Question image
At 60 seconds, how far had this object traveled? 
1
0 m
2
10 m
3
20 m
4
40 m

20

Multiple Choice

Question image

How long did it take this object to travel 10 m?

1

0 s

2

10 s

3

15 s

4

20 s

21

Multiple Choice

Question image
How long did it take this object to travel 10 m?
1
0 s
2
10 s
3
15 s
4
20 s

22

If SPEED or VELOCITY is on the y-axis....

  • You're looking at how fast something has moved over time

  • This can tell you how much something has accelerated

  • A STRAIGHT LINE DOES NOT MEA IT IS STOPPED!!! It's still moving at a steady speed!!!!

Slide image

23

Multiple Choice

Question image

Part A of the graph is from 0s to 25s. Which of these statements is true about Part A?

1

The object is at rest.

2

The object is accelerating (its velocity is increasing)

3

The object is decelerating (its velocity is decreasing)

4

The object is moving at a constant velocity.

24

Multiple Choice

Question image

Part B of the graph is from 25s to 35s. Which of these statements is true about Part B?

1

The object is at rest.

2

The object is accelerating (its velocity is increasing)

3

The object is decelerating (its velocity is decreasing)

4

The object is moving at a constant velocity.

25

Multiple Choice

Speed is different from velocity because
1
Velocity has a direction
2
Speed uses Distance /Time
3
Velocity doesn't include time
4
Velocity doesn't include distance

26

Multiple Choice

Question image

Velocity is speed with __________________________.

1

a unicycle helmet

2

direction

3

fight

27

Multiple Choice

Question image
Which section of the graph shows deceleration?
1
AB
2
BC
3
EF
4
GH

28

Multiple Choice

Question image
Which section of the graph shows constant velocity?
1
AB
2
BC
3
EF
4
GH

29

Multiple Choice

Question image
Which section of the graph shows decreasing velocity?
1
CD
2
DE
3
EF
4
GH

30

Multiple Choice

Question image

What is happening from point D to E?

1

The object is moving SLOWLY

2

The object is moving FAST

3

The object is decelerating

4

The object is NOT moving

31

Multiple Choice

Question image

Part C of the graph is from 35s to 55s. Which of these statements is true about Part C?

1

The object is at rest.

2

The object is accelerating (its velocity is increasing)

3

The object is decelerating (its velocity is decreasing)

4

The object is moving at a constant velocity.

32

Multiple Choice

On a distance vs. time graph, the steeper the slope _____
1
the slower the speed
2
the faster the speed
3
less acceleration
4
greater acceleration

Analyzing Physics Graphs

Slide image

Show answer

Auto Play

Slide 1 / 32

SLIDE