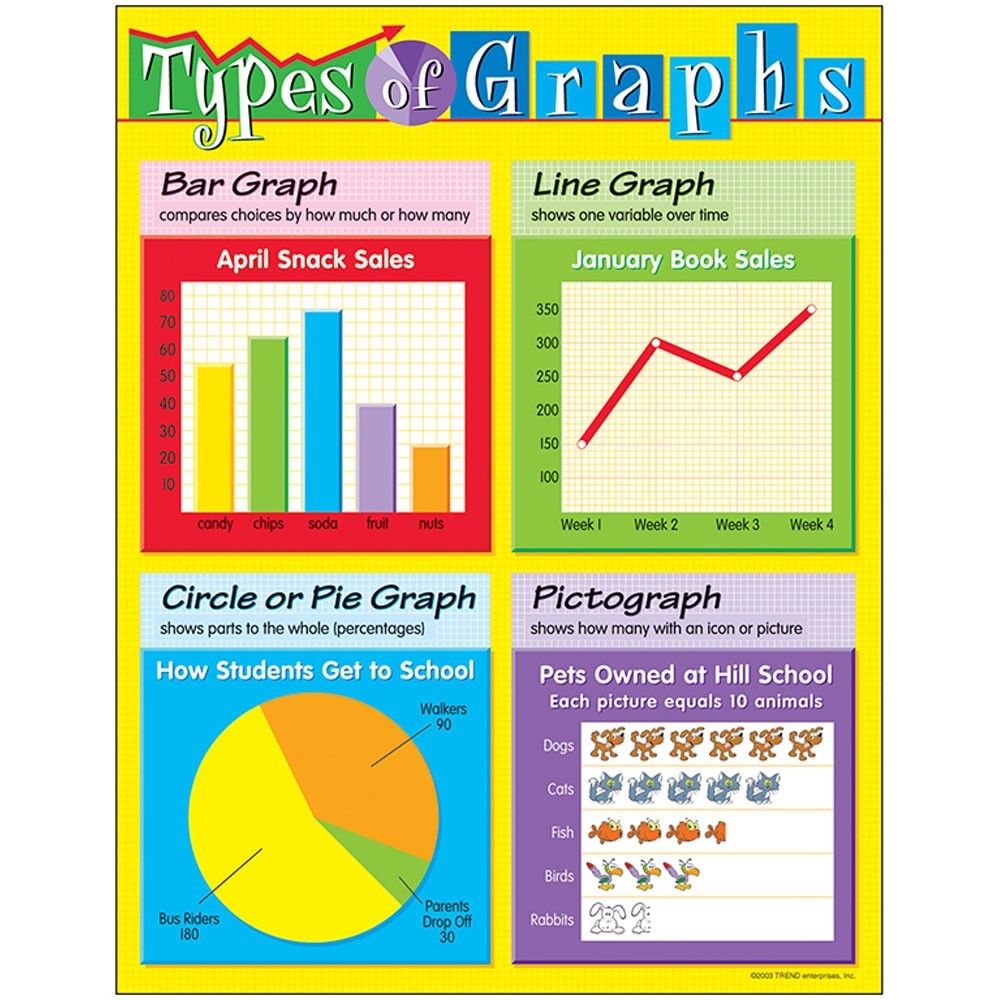
Search Header Logo
  1. Resource Library
  2. Math
  3. Data And Graphing
  4. Types Of Graphs
  5. Types Of Graphs
Types of Graphs

Types of Graphs

Assessment

Presentation

Mathematics

5th - 6th Grade

Practice Problem

Medium

CCSS
3.MD.B.3, 2.MD.D.9, 6.SP.B.4

+4

Standards-aligned

Created by

ice girl

Used 122+ times

FREE Resource

3 Slides • 20 Questions

1

Types of Graphs

Slide image

2

Slide image

3

Slide image

4

Multiple Choice

Question image

Which type of graph is this?

1

Histogram

2

Bar Graph

3

Stem Plot

4

Box Plot

5

Multiple Choice

Question image

What type of graph is this?

1

Bar Graph

2

Histogram

3

Dot Plot

4

Pie Graph

6

Multiple Choice

Question image
What type of graph is this?
1
Bar Graph
2
Dot Plot
3
Histogram
4
Line Graph

7

Multiple Choice

Question image

What type of graph is this?

1

Bar graph

2

Histogram

3

Pie Chart

4

Stem Chart

8

Multiple Choice

Question image

When would I use a graph like this?

1

To see small changes over time

2

To compare parts to a whole

3

To compare categories

4

To see frequency

9

Multiple Choice

Question image

A pie chart allows you to easily see

1

information about the proportion of parts relative to the whole.

2

the total number of each category.

3

how much data occurs within a range of numbers.

10

Multiple Choice

Question image

Which type of graph shows change over time?

1

bar graph

2

line graph

3

circle graph

11

Multiple Choice

I have an x-axis and a y-axis. I help to show frequency. There are no spaces between my bars. What am I?

1

Bar Graph

2

Histogram

3

Line Graph

4

Dot Plot

12

Multiple Choice

I have an x-axis and a y-axis. I help to compare categories. There are spaces between my bars. What am I?

1

Bar Graph

2

Histogram

3

Line Graph

4

Dot Plot

13

Multiple Choice

I have an x-axis and a y-axis. I help to track changes over time. What am I?

1

Circle Graph

2

Histogram

3

Line Graph

4

Bar Graph

14

Multiple Choice

I have no axes at all. I help compare parts to a whole. What am I?

1

Circle Graph

2

Histogram

3

Line Graph

4

Bar Graph

15

Multiple Choice

Question image

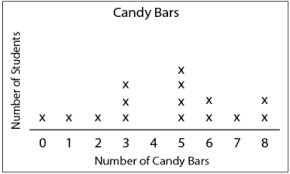
How many students had more than 6 candy bars?

1

5

2

2

3

3

4

1

16

Multiple Choice

Question image

How many total votes were collected?

1

5

2

10

3

15

4

20

17

Multiple Choice

Question image

What is the title of this graph?

1

School Transportation

2

Bus

3

No title

4

Pie Graph

18

Multiple Choice

Question image

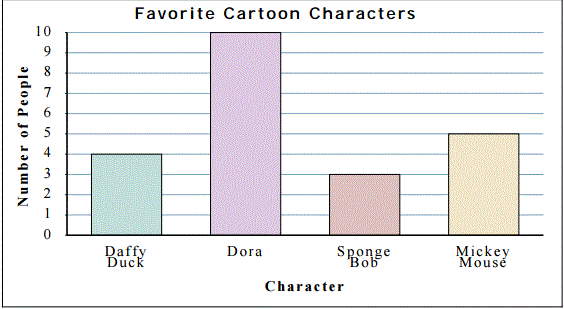
What is the title of the graph?

1

Number of people

2

Character

3

Favorite Cartoon Characters

4

Sponge Bob

19

Multiple Choice

Question image

How many students have blue for a favorite color?

1

11

2

12

3

14

4

17

20

Multiple Choice

Question image

How many more people like purple than red?

1

3

2

5

3

7

4

9

21

Multiple Choice

Question image

Name the type of graph.

1

pie chart

2

tally chart

3

pictograph

4

bar graph

22

Multiple Choice

Question image

Name the type of graph.

1

pie chart

2

tally chart

3

pictograph

4

bar graph

23

Multiple Choice

Question image

Name the type of graph.

1

pie chart

2

tally chart

3

pictograph

4

bar graph

Types of Graphs

Slide image

Show answer

Auto Play

Slide 1 / 23

SLIDE