Search Header Logo
  1. Resource Library
  2. Math
  3. Probability And Statistics
  4. Frequency Distribution
  5. Frequency Distribution Table
Frequency Distribution Table

Frequency Distribution Table

Assessment

Presentation

Mathematics

11th - 12th Grade

Practice Problem

Medium

CCSS
6.SP.B.5C, 6.SP.B.4, HSS.ID.A.1

Standards-aligned

Created by

Elizabeth Borres

Used 24+ times

FREE Resource

13 Slides • 6 Questions

1

Describing Data: Frequency Distribution Table and Graphic Presentation

ELizabeth Borres

Slide image

2

Slide image

3

Slide image

4

Multiple Choice

What does "mean" mean?
1
average
2
middle
3
repeats the most
4
variation

5

Multiple Choice

Question image

There are 300 seventh graders, 75 students prefer choir.

1

True

2

False

6

Multiple Choice

Question image

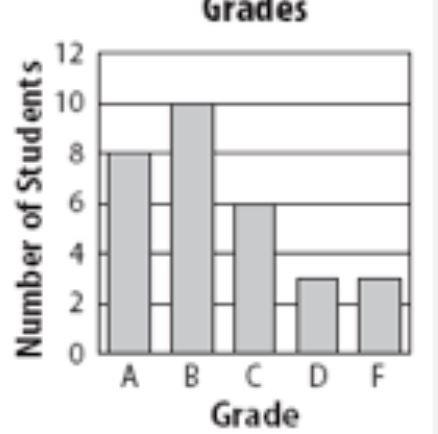
The bar graph displays grades for a 7th grade class. The percent of students that made an A is 33%.

1

True

2

False

7

Multiple Choice

Question image

Students were surveyed about their favorite sports to play in phys.ed. The results are represented in this circle graph. If 48 students were surveyed, then 14 students chose soccer?

1

True

2

False

8

Multiple Choice

Question image

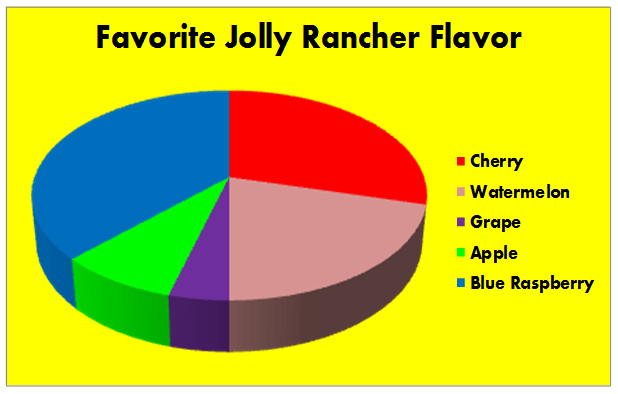
According to this graph, Blue Raspberry is the most popular flavor of Jolly Rancher?

1

True

2

False

9

This chapter presents a technique that is used to organize raw data into some meaningful form.

It is called a FREQUENCY DISTRIBUTION.

10

FREQUENCY DISTRIBUTION :

A grouping of data into mutually exclusive classes showing the number of observations in each.

11

FREQUENCY DISTRIBUTION :

It is used to summarize and organize large amounts of data.

12

Slide image

13

Slide image

14

Slide image

15

Slide image

16

Slide image

17

Slide image

18

Slide image

19

Poll

Do you have any question(s)/clarification(s)?

Describing Data: Frequency Distribution Table and Graphic Presentation

ELizabeth Borres

Slide image

Show answer

Auto Play

Slide 1 / 19

SLIDE