Search Header Logo
Thursday 2/11--Line of Best Fit

Thursday 2/11--Line of Best Fit

Assessment

Presentation

Mathematics

8th Grade

Medium

CCSS
8.EE.B.5, HSF-LE.A.1B, 8.F.B.4

+6

Standards-aligned

Created by

Katie Butler

Used 13+ times

FREE Resource

36 Slides • 18 Questions

1

Thursday 2/11--Line of Best Fit

Complete your minutes for today

Slide image

2

I can find and interpret line of best fit

Mod 6 Lesson 7 and 8

3

Review from Tuesday

Scatter Plots and Association

4

Multiple Choice

Question image
What type of association does this graph have?
1
positive 
2
negative
3
none
4
all of the above

5

Multiple Choice

Question image
What type of association does this scatter plot represent?
1
positive linear association
2
negative association
3
no association
4
nonlinear association

6

Multiple Choice

Question image
Which scatter plot shows a linear relationship between x and y?
1
Graph A
2
Graph B
3
Graph C
4
Graph D

7

Multiple Choice

Question image
What type of correlation does this graph show?
1
Positive
2
negative
3
none
4
all of the above

8

Multiple Choice

Question image
What type of correlation does this scatter plot show?
1
positive linear association
2
negative linear association
3
no association
4
nonlinear association

9

Multiple Choice

Question image

What are the coordinates of the outlier?

1

(1,9)

2

(9,1)

3

(2,2)

4

y=x

10

Slide image

11

Slide image

12

Slide image

13

Slide image

14

Slide image

15

Slide image

16

Slide image

17

Slide image

18

Slide image

19

Slide image

20

Slide image

21

Slide image

22

Slide image

23

Slide image

24

Line of Best Fit Quizizz Questions

25

Multiple Choice

Question image

Which line is the best line of best fit?

1

a

2

b

3

c

4

i don't see any lines

26

Multiple Choice

Question image

Is this line an accurate line estimate of best fit for the data?

1

Yes

2

No

27

Multiple Choice

Question image

Is this line an accurate line estimate of best fit for the data?

1

Yes

2

No

28

Slide image

29

Slide image

30

Slide image

31

Slide image

32

Slide image

33

Slide image

34

Slide image

35

Slide image

36

Slide image

37

Slide image

38

Slide image

39

Slide image

40

Finding Equation of a Line Review

y = mx + b

41

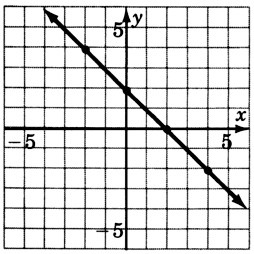
Find slope; Find y-intercept

y = mx + b

Slide image

42

Equation of a Line Quizizz

43

Multiple Choice

Question image
Which equation is being represented by this line?
1
y = -1x + 2
2
y = 1/2x + 2
3
y = 3x -4
4
y = -3x +2

44

Multiple Choice

Question image
Which equation represents the following graph?
1
y = 3x + 2
2
y = -2x + 3
3
y = 2x + 3
4
y = -3x + 2

45

Multiple Choice

Question image
What is the y-intercept of the line graphed below?
1
3
2
4
3
-3
4
4/3

46

Multiple Choice

Question image
Find the slope
1
-2/3
2
3/2
3
-3/2
4
2/3

47

Multiple Choice

What is the y- intercept of the graph of y = -5x + 6

1

5

2

-5

3

6

4

-6

48

Slide image

49

Summary Quizizz Questions

50

Multiple Choice

Question image

What is the equation of the line of best fit?

1

y= 2x+3

2

y=3x+2

3

y= 12x +3\frac{1}{2}x\ +3

4

y= 12x +3-\frac{1}{2}x\ +3

51

Multiple Choice

Question image

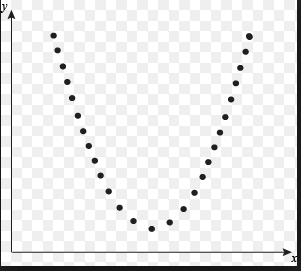
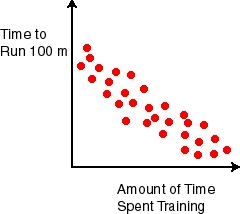
Which sentence describes the relationship shown on this scatter plot?

1

As the temperature decreases, the visitors increase.

2

As the temperature increases, the number of visitors increases.

3

As the visitors increase, the temperature decreases.

4

No correlation

52

Multiple Choice

Question image

What is the equation of the line of best fit

1

y= -2x + 10

2

y= 10x+ 2

3

y=2x+10

4

y= 10

53

Multiple Choice

Question image

What is the equation of the line of best fit?

1

y= 12x + 6-\frac{1}{2}x\ +\ 6

2

y= 12x +6\frac{1}{2}x\ +6

3

y= 6x + 2

4

y = -2x +6

54

Lesson 8 Pset #1,2,3

Lesson 9 Pset #1,3

Quizizz on Functions

Code: 47397996

Thursday 2/11--Line of Best Fit

Complete your minutes for today

Slide image

Show answer

Auto Play

Slide 1 / 54

SLIDE