Search Header Logo
  1. Resource Library
  2. Math
  3. Data And Graphing
  4. Reading Graphs
  5. Bar Graphs
Bar graphs

Bar graphs

Assessment

Presentation

Mathematics

7th Grade

Easy

CCSS
3.MD.B.3, 2.MD.D.10, 2.MD.D.9

+6

Standards-aligned

Created by

Maryam Ouiles

Used 176+ times

FREE Resource

8 Slides • 9 Questions

1

Bar graphs

L.O. To construct and interpret bar graphs.

Slide image

2

When to use a bar graph?

  • A bar graph is a graph that uses bars of different lengths to compare data.

  • The graph compares different categories.

  • The graph shows how many in each category.

3

Slide image

4

Multiple Select

Question image

What is wrong with this bar graph?

1

It has no title and no label on the vertical axis

2

There should be a space between the bars

3

The bars should all be the same colour but different widths

4

The scale on the vertical axis is wrong.

5

Data will be given by category and frequency, for example:

  • Categories : Flavours of ice cream, types of trees, favourite animals, colours of cars.

  • Frequency: Number sold, number of each, number of students who chose it.

6

Slide image

7

Multiple Choice

Question image

Which graph shows this data?

1
2
3
4

8

Slide image

9

Poll

Which flavour crisp is your favourite?

Ready salted

Salt and vinegar

Cheese and onion

10

Poll

Which is your favourite season?

Spring

Summer

Autumn

Winter

11

Draw a bar chart to represent the data collected.

You will need to put number of students up the side . Make sure you use a proper scale.

Put flavours of crisps along the bottom in the first one and seasons along the bottom for the second one.

Don't forget a title, labels for the axes, bars of equal width and a space between the bars.

12

Reading bar graphs

Look for the category and read off the number on the vertical axis which is at the same height as that bar.

13

Multiple Choice

Question image
How many students take the bus to school?
1
35
2
20
3
10
4
15

14

Multiple Choice

Question image
1

Ginger Snap

2

Oatmeal Cookie

3

Sugar Cookie

15

Multiple Choice

Question image

How many chickens does Nate have on his farm?

1

11

2

12

3

9

4

10

16

Multiple Choice

Question image

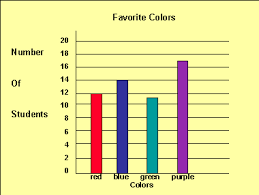
How many students' favorite color is blue?

1

11

2

12

3

14

4

17

17

Multiple Choice

Question image

How many more people like purple than red?

1

3

2

5

3

7

4

9

Bar graphs

L.O. To construct and interpret bar graphs.

Slide image

Show answer

Auto Play

Slide 1 / 17

SLIDE