
Organizing and Displaying Data
Presentation
•
Mathematics
•
9th - 12th Grade
•
Medium
+4
Standards-aligned
Robert Tinaro
Used 8+ times
FREE Resource
12 Slides • 22 Questions
1
Organizing and Displaying Data
Review for Unit Test
2
3
Multiple Choice
The cell phone listed as third best on an online electronics review website.
Nominal
Ordinal
Interval
Ratio
4
Multiple Choice
The number of hours you spent studying each day during the past week
Nominal
Ordinal
Interval
Ratio
5
Fill in the Blank
Type answer...
6
Multiple Choice
Ethnic group categories of people in a neighborhood.
Nominal
Ordinal
Interval
Ratio
7
8
9
10
Multiple Choice
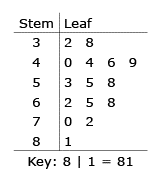
A florist records the amount of money he spent on gasoline each week to deliver orders. The list shows the data for 16 weeks.
32, 38, 40, 44, 44, 46, 49, 53, 55, 58, 62, 65, 68, 70, 72, 81
He put the data in a stem-and-leaf plot. What number did he leave out of the stem-and-leaf plot?
32
44
65
84
11
Multiple Choice
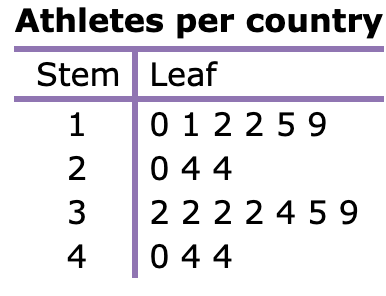
While doing a project for P. E. class, Ling researched the number of athletes competing in an international sporting event.
How many countries have exactly 32 athletes?
4
3
6
1
12
Multiple Choice
Altogether, how many people had 3 or more pets in their home?
3
7
4
11
13
Multiple Choice
14
Multiple Choice
15
Multiple Choice
16
Multiple Choice
17
Multiple Choice
18
Multiple Choice
19
20
21
22
23
24
25
26
Multiple Choice
27
Multiple Choice
The vertical axis of an ogive comes from this column:
Class
Frequency
Midpoint
Cumulative Frequency
Class Endpoints
28
Multiple Choice
The vertical axis of a histogram comes from this column:
Class
Frequency
Midpoint
Cumulative Frequency
Class Endpoints
29
Multiple Choice
The horizontal axis of a histogram comes from this column:
Class
Frequency
Midpoint
Cumulative Frequency
Class Endpoints
30
Multiple Choice
The vertical axis of a frequency polygon comes from this column:
class width
frequency
class midpoint
class boundaries
31
Multiple Choice
The horizontal axis of a frequency polygon comes from this column:
Class width
Frequency
Midpoint
Class Endpoints
Class Boundaries
32
Multiple Choice
According to the portion of the frequency table given, how many people have an MBA?
9
20
60
not enough information
33
Multiple Choice
Given above are marks obtained by 20 students in Math out of 25 presented in grouped frequency distribution table.
How many classes are in this table?
1
2
3
4
34
Multiple Choice
Given above are marks obtained by 20 students in Math out of 25.
Find the value of x.
4
5
7
8
Organizing and Displaying Data
Review for Unit Test
Show answer
Auto Play
Slide 1 / 34
SLIDE
Similar Resources on Wayground
25 questions
SSS, HL, and SAS Review
Presentation
•
9th - 12th Grade
27 questions
Solving Quadratic Equations by Quadratic Formula
Presentation
•
9th - 12th Grade
23 questions
Equations of Circles
Presentation
•
9th - 12th Grade
26 questions
Exponent Properties
Presentation
•
9th - 12th Grade
27 questions
Inverse Variation
Presentation
•
9th - 12th Grade
27 questions
Multiplying Monomials and Binomials
Presentation
•
9th - 12th Grade
23 questions
Factoring X-Game
Presentation
•
9th - 12th Grade
29 questions
Finding Sides of Right Triangles using Trig Ratios
Presentation
•
8th - 12th Grade
Popular Resources on Wayground
10 questions
5.P.1.3 Distance/Time Graphs
Quiz
•
5th Grade
10 questions
Fire Drill
Quiz
•
2nd - 5th Grade
20 questions
Equivalent Fractions
Quiz
•
3rd Grade
22 questions
School Wide Vocab Group 1 Master
Quiz
•
6th - 8th Grade
20 questions
Main Idea and Details
Quiz
•
5th Grade
20 questions
Context Clues
Quiz
•
6th Grade
20 questions
Inferences
Quiz
•
4th Grade
12 questions
What makes Nebraska's government unique?
Quiz
•
4th - 5th Grade
Discover more resources for Mathematics
20 questions
Graphing Inequalities on a Number Line
Quiz
•
6th - 9th Grade
20 questions
Exponential Functions Key Features
Quiz
•
9th Grade
11 questions
Adding and Subtracting Polynomials
Quiz
•
9th Grade
12 questions
Exponential Growth and Decay
Quiz
•
9th Grade
20 questions
Box and Whisker Plots
Quiz
•
9th Grade
25 questions
Complementary and Supplementary Angles
Quiz
•
7th - 10th Grade
15 questions
Graphing Inequalities
Quiz
•
7th - 9th Grade
21 questions
Factoring Trinomials (a=1)
Quiz
•
9th Grade