
Line Plots
Presentation
•
Mathematics
•
7th Grade
•
Easy
•
CCSS
3.MD.B.4, 4.MD.B.4, 2.MD.D.9
+2
Standards-aligned

Daffney Brown
Used 6+ times
FREE Resource
2 Slides • 9 Questions
1
Line Plots
Unit 8 Note Packet

2
3
Multiple Choice

What is the least amount of siblings that students had in the class?
4
Multiple Choice

What was the most siblings a student had in the class?
5
Multiple Choice

What was the highest number of goals scored by a player?
6
Multiple Choice

How many students received a score of 94%?
7
Multiple Choice

How many students scored 93% or less?
8
Multiple Choice
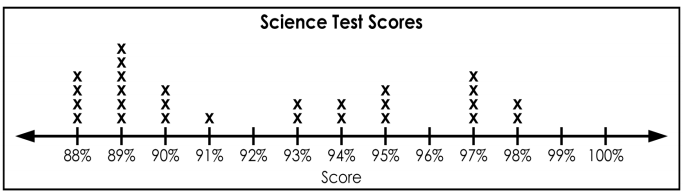
What is the highest score in the class?
9
Multiple Choice

How many students received a score in the 80's?
10
Multiple Choice
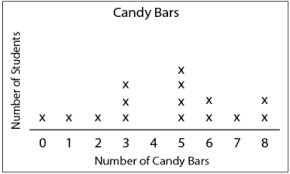
How many students had more than 6 candy bars?
11
Multiple Choice
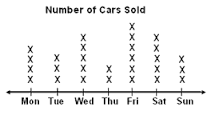
How many cars were sold on Saturday and Sunday?
Line Plots
Unit 8 Note Packet
Show answer
Auto Play
Slide 1 / 11
SLIDE
