Search Header Logo
  1. Resource Library
  2. Science
  3. Units And Measurement
  4. Calculations
  5. Graphing Motion And Speed Calculations
Graphing motion and speed calculations

Graphing motion and speed calculations

Assessment

Presentation

Science

6th Grade

Medium

NGSS
MS-PS3-1, MS-PS2-2

Standards-aligned

Created by

Angela Drake

Used 194+ times

FREE Resource

10 Slides • 12 Questions

1

Graphing motion and speed calculations

Slide image

2

3

Multiple Choice

Question image

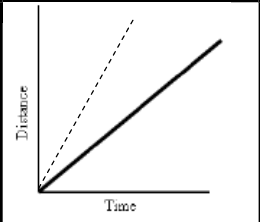
In the graph, which runner is the fastest?

1

Red

2

Blue

4

The runner in red is the fastest

The steeper the line the faster they are moving

Slide image

5

Multiple Choice

Question image

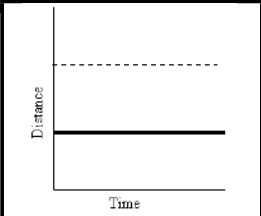
What happens to the runner at 1-3 seconds?

1

The runner slowed down

2

The runner stopped

3

The runner sped up

6

Between 1-3 seconds the runner stopped

The distance stays the same and the line is flat

Slide image

7

Multiple Choice

Question image

What does the runner do between 3-4 seconds?

1

The runner sped up

2

The runner slowed down

3

The runner went back towards the start line

8

The runner returns towards the start line between 3-4 seconds

A line moving down shows an object returning to where it started

Slide image

9

10

Multiple Choice

What is the equation to calculate speed?
1
speed = distance/time
2
speed = time/distance
3
speed = time x distance 
4
speed = speed/time 

11

Multiple Choice

What is the speed of a man who runs 10 miles in 1 hr?
1
20 miles
2
10 m/min
3
10 miles/hr
4
20 hrs

12

10/1=10 miles/hr

Speed= distance/ time

Slide image

13

Multiple Choice

A runner races in the 100-meter dash. It takes her 10 seconds to finish. What is her average speed?

1

10 m/s

2

1000 m/s

3

100 seconds

4

10 seconds

14

100/10= 10 m/s

Speed= distance/ time

Slide image

15

Multiple Choice

What is the speed of an object that travels 60 meters in 4 seconds?
1
240 m/s
2
15 m/s
3
0.067 m/s
4
15 mph

16

60/4= 15 m/s

Speed= distance/ time

Slide image

17

Extra Graphing and Speed Problems


Slide image

18

Multiple Choice

Question image

A runner races in the 100 meter dash. It takes her 10 seconds to finish. What is her average speed?

1

10 m/s

2

1000 m/s

3

100 seconds

4

10 seconds

19

Multiple Choice

Bill jogs 400 meters to Andy's house, turns around, and runs 400 meters back home.  He does so in 267 seconds.  What is Bill's average speed?
1
about 3 m/s
2
about 1.5 m/s
3
0
4
about 4 m/s

20

Multiple Choice

Question image
What does this graph represent?
1
Constant speed
2
Acceleration
3
Not moving

21

Multiple Choice

Question image
What does this graph represent?
1
Constant Speed
2
Acceleration
3
Not moving

22

Multiple Choice

Question image

Which runner won the race?

1

Albert

2

Bob

3

Charlie

Graphing motion and speed calculations

Slide image

Show answer

Auto Play

Slide 1 / 22

SLIDE