
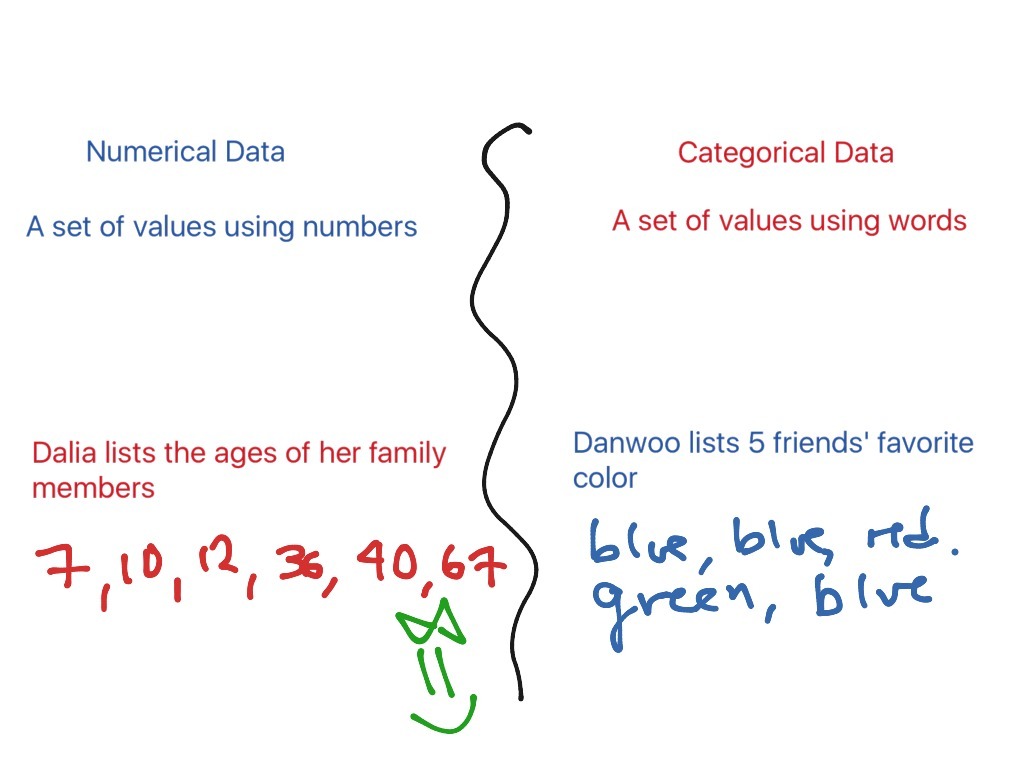
6.SP1 LESSON: Categorical and Numerical Data
Presentation
•
Mathematics
•
6th Grade
•
Easy
•
CCSS
6.SP.B.5C, 3.MD.B.4, HSN.VM.C.6
+1
Standards-aligned

Denise Miranda
Used 23+ times
FREE Resource
5 Slides • 12 Questions
1
6.SP1 LESSON: Categorical and Numerical Data
2
3
Poll
4
Poll
5
Poll
6
Poll
7
8
9
10
Multiple Choice

What is the shape of the dot plot shown?
11
Multiple Choice
What is the median of the data?
12
Multiple Choice
How many total students were surveyed about their number of brothers and sisters? (add up all of the dots)
13
Multiple Choice

How many students have a shoe size bigger than 8?
14
Multiple Choice
15
Multiple Choice

What is the MEDIAN of this data?
16
Multiple Choice
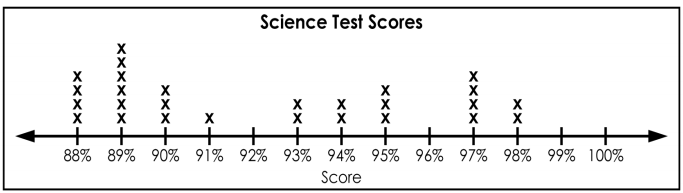
How many students received a score of 94%?
17
Multiple Choice

What is the highest score in the class?
6.SP1 LESSON: Categorical and Numerical Data
Show answer
Auto Play
Slide 1 / 17
SLIDE
