Search Header Logo
  1. Resource Library
  2. Math
  3. Data And Graphing
  4. Graph Analysis
  5. Histograms And Box Plot Review
Histograms and Box Plot Review

Histograms and Box Plot Review

Assessment

Presentation

Mathematics

6th Grade

Medium

CCSS
6.SP.B.4, 6.SP.B.5C, HSA.CED.A.3

+1

Standards-aligned

Created by

Bryant Stewart

Used 404+ times

FREE Resource

3 Slides • 9 Questions

1

Histograms and Box Plot Review

Slide image

2

Slide image

3

Slide image

4

Multiple Choice

Which of the following best describes the process of finding the interquartile range for a set of data?

1

Add the biggest and smallest numbers.

2

Place the numbers in order from least to greatest and find the middle.

3

Find the difference between the maximum and the minimum.

4

Subtract Q1 from Q3.

5

Multiple Choice

Question image

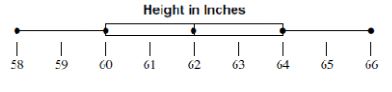
What data value is the upper quartile (Q3)?

1

64

2

62

3

66

4

58

6

Multiple Choice

Question image

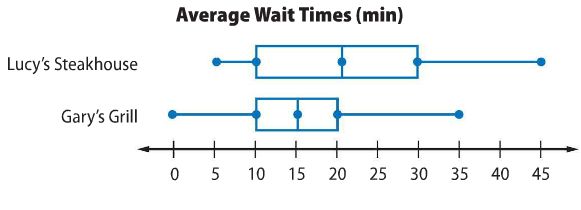
Which restaurant has a higher median wait time?

1

Lucy's Steakhouse

2

Gary's Grill

3

They are the same

7

Multiple Choice

Question image

What is the median of the data?

1

200

2

100

3

90

4

140

8

Multiple Choice

Question image

What is the interquartile range?

1

4

2

6

3

2

4

8

9

Multiple Choice

Question image
How many students have more than 1,000 songs on their MP3 player?
1
5
2
16
3
10
4
4

10

Multiple Choice

Question image
How many cities have temperatures between 70 degrees and 99 degrees?
1
44
2
34
3
26
4
62

11

Multiple Choice

Question image
Which interval has 400 employees?
1
33-43
2
0-10
3
77-87
4
66-76

12

Multiple Choice

Question image
What type of graph is this?
1
Bar Graph
2
Histogram
3
Line Plot

Histograms and Box Plot Review

Slide image

Show answer

Auto Play

Slide 1 / 12

SLIDE