Search Header Logo
  1. Resource Library
  2. Math
  3. Probability And Statistics
  4. Two Way Frequency Tables
  5. Two Way Tables
Two way tables

Two way tables

Assessment

Presentation

Mathematics

10th Grade

Medium

CCSS
8.SP.A.4, 6.RP.A.3C

Standards-aligned

Created by

Nicole Nelms

Used 12+ times

FREE Resource

1 Slide • 9 Questions

1

Two way tables

Good morning everyone

Terrific Tuesday in store for ALL!!!!!

media

2

Multiple Choice

Question image

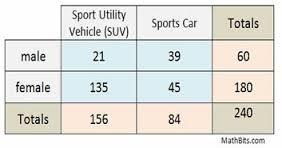
What percentage of SUV's are driven by women?

1

56.25%

2

75%

3

83.25%

4

86.5%

3

Multiple Choice

Question image
What percentage of males drive sports cars?
1
35%
2
16.25%
3
65%
4
25%

4

Multiple Choice

Question image

What percent of males prefer basketball?

1

22%

2

155

3

77%

4

29%

5

Multiple Choice

Question image

What percent of all students were females who prefer football?

1

16%

2

80%

3

8%

4

12%

6

Multiple Choice

Question image

Which percent is higher, males who prefer baseball or females who prefer baseball?

1

Males at 19%

2

Females at 19%

3

Females at 62%

4

Males at 62%

7

Multiple Choice

Question image

How many people were surveyed? BE CAREFUL AND LOOK AT THE TABLE COMPLETELY.....MAYBE DRAW IT TOO....

1

52

2

60

3

240

4

77

8

Multiple Choice

Question image

35 children were asked if they prefer cats or dogs. The data is shown in the table. How many girls prefer dogs?

1

Don't have enough information

2

2

3

23

4

29

9

Multiple Choice

Question image

What sport is the most popular?et

1

Cricket

2

Rugby

3

Football

4

Cricket and netball

10

Multiple Choice

Question image

How many more children prefer playing cricket than netball?

1

1

2

7

3

6

4

5

Two way tables

Good morning everyone

Terrific Tuesday in store for ALL!!!!!

media

Show answer

Auto Play

Slide 1 / 10

SLIDE