

Scatterplots
Presentation
•
Mathematics
•
9th Grade
•
Medium
+2
Standards-aligned
Blake Emerton
Used 66+ times
FREE Resource
8 Slides • 14 Questions
1
Scatterplots

2
3
Multiple Choice
4
Multiple Choice
5
Multiple Choice
Which graph shows a line of best fit for the scatter plot?
Graph A
Graph B
Graph C
Graph D
6
7
8
Multiple Choice
The scatter plot shows the relationship between the number of chapters and the total number of pages for several books. Use the trend line to predict how many chapters would be in a book with 180 pages.
12 chapters
15 chapters
18 chapters
21 chapters
9
Multiple Choice
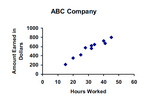
Based on this scatterplot, approximate what score should a student who attended class 22 days expect to receive on the exam?
84
71
95
75
10
11
Multiple Choice
What is the equation of the line of best fit
y= -2x + 10
y= 10x+ 2
y=2x+10
y= 10
12
Multiple Choice
What is the equation of the line of best fit?
y= −21x + 6
y= 21x +6
y= 6x + 2
y = -2x +6
13
14
Multiple Choice
Describe the correlation, if the correlation coefficient is r = -0.26
Positive, weak
Negative, weak
Positive, strong
Negative, strong
15
Multiple Choice
Estimate the correlation coefficient for this scatterplot.
A) r = -0.9
B) r = 1
C) r = 0.9
D) r = -1
16
Multiple Choice
Estimate the correlation coefficient for this scatterplot.
A) r = 1.2
B) r = 0.89
C)r = 0
D) r = -0.89
17
Multiple Choice
Average time spent listening to music per day and average time spent watching TV per day. r=−.17
strong positive
strong negative
weak positive
weak negative
18
Multiple Choice
Score on science exam and number of words written on the essay question. r=.28
strong positive
strong negative
weak positive
weak negative
19
Multiple Choice
Car weight and distance traveled using a full tank of gas. r=−.86
strong positive
strong negative
weak positive
weak negative
20
Multiple Choice
Number of steps taken per day and number of kilometers walked per day. r=.92
strong positive
strong negative
weak positive
weak negative
21
Correlation Coefficient
22
Correlation Coefficient (r value)
from the calculator
Find r of the following data set:
(1,10)
(5,20)
(3,15)
(2,14)
(1,8)
(0,3)
(4,15)
(1,8)
(2,9)
Scatterplots

Show answer
Auto Play
Slide 1 / 22
SLIDE
Similar Resources on Wayground
18 questions
2.1.3 Algebra 1 Lesson
Presentation
•
9th Grade
15 questions
Factoring Diamonds
Presentation
•
9th - 10th Grade
17 questions
Multiplying Exponents
Presentation
•
9th Grade
17 questions
Exponential Functions: Growth and Decay
Presentation
•
9th Grade
16 questions
Volumen de conos
Presentation
•
9th Grade
16 questions
Exponent Rules Review Quizizz
Presentation
•
9th Grade
18 questions
Causation
Presentation
•
9th Grade
16 questions
1.4 Dilations
Presentation
•
9th - 10th Grade
Popular Resources on Wayground
20 questions
STAAR Review Quiz #3
Quiz
•
8th Grade
20 questions
Equivalent Fractions
Quiz
•
3rd Grade
6 questions
Marshmallow Farm Quiz
Quiz
•
2nd - 5th Grade
20 questions
Main Idea and Details
Quiz
•
5th Grade
20 questions
Context Clues
Quiz
•
6th Grade
20 questions
Inferences
Quiz
•
4th Grade
19 questions
Classifying Quadrilaterals
Quiz
•
3rd Grade
12 questions
What makes Nebraska's government unique?
Quiz
•
4th - 5th Grade
Discover more resources for Mathematics
7 questions
Warm Up 04.01.2026
Quiz
•
9th Grade
20 questions
Graphing Inequalities on a Number Line
Quiz
•
6th - 9th Grade
20 questions
Linear Functions Review
Quiz
•
9th Grade
10 questions
Pythagorean Theorem and its Converse
Quiz
•
7th - 9th Grade
20 questions
Box and Whisker Plots
Quiz
•
9th Grade
16 questions
Circles - Equations, Central & Inscribed Angles
Quiz
•
9th - 12th Grade
20 questions
Function or Not a Function
Quiz
•
8th - 9th Grade
10 questions
Calculating Surface Area of a Triangular Prism
Interactive video
•
6th - 10th Grade