
Station Models Lab
Presentation
•
Science
•
8th - 10th Grade
•
Practice Problem
•
Medium
+3
Standards-aligned

D. Frank
Used 60+ times
FREE Resource
13 Slides • 36 Questions
1
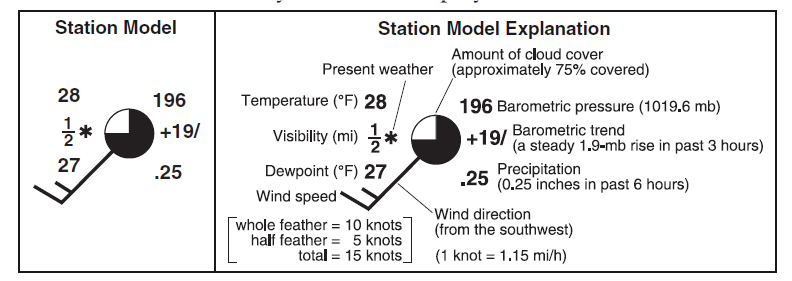
Station Models Lab
All the weather data

2
3
4
5
6

7
8
Station 1

9
Fill in the Blanks

Type answer...
10
Fill in the Blanks

Type answer...
11
Fill in the Blanks

Type answer...
12
Fill in the Blanks

Type answer...
13
Fill in the Blanks

Type answer...
14
Fill in the Blanks

Type answer...
15
Fill in the Blanks

Type answer...
16
Fill in the Blanks

Type answer...
17
Fill in the Blanks

Type answer...
18
Station 2

19
Fill in the Blanks

Type answer...
20
Fill in the Blanks

Type answer...
21
Fill in the Blanks

Type answer...
22
Fill in the Blanks

Type answer...
23
Fill in the Blanks

Type answer...
24
Fill in the Blanks

Type answer...
25
Fill in the Blanks

Type answer...
26
Fill in the Blanks

Type answer...
27
Station 3

28
Fill in the Blanks

Type answer...
29
Fill in the Blanks

Type answer...
30
Fill in the Blanks

Type answer...
31
Fill in the Blanks

Type answer...
32
Fill in the Blanks

Type answer...
33
Fill in the Blanks

Type answer...
34
Fill in the Blanks

Type answer...
35
Fill in the Blanks

Type answer...
36
Station 4
Notice that this station model does not have a wind direction or speed. When this occur we say the wind is calm

37
Fill in the Blanks

Type answer...
38
Fill in the Blanks

Type answer...
39
Fill in the Blanks

Type answer...
40
Fill in the Blanks

Type answer...
41
Fill in the Blanks

Type answer...
42
Fill in the Blanks

Type answer...
43
44
45
Multiple Choice
46
Multiple Choice
47
Multiple Choice

Various weather conditions at LaGuardia Airport in New York City are shown on the station model.
What were the barometric pressure and weather conditions at the airport at the time of the observation?
48
Multiple Choice
49
Multiple Choice

The diagrams represent station models showing weather data collected at four different times during one day at a location in the
United States.
Refer to Figure 2 and answer the following Question:
At what time was the probability of precipitation greatest at this location?
Station Models Lab
All the weather data
Show answer
Auto Play
Slide 1 / 49
SLIDE
