Search Header Logo
4/19 Week 2 Review Pre-Assessment

4/19 Week 2 Review Pre-Assessment

Assessment

Presentation

Mathematics

8th Grade

Medium

Created by

Jaye Sanford

Used 1+ times

FREE Resource

9 Slides • 46 Questions

1

4/19 Week 2 Review Pre-Assessment

What do we need to review?

Slide image

2

Proportional vs

Non-Proportional Relationships

What makes an equation, graph, table, and situation proportional?

Slide image

3

Multiple Choice

Question image

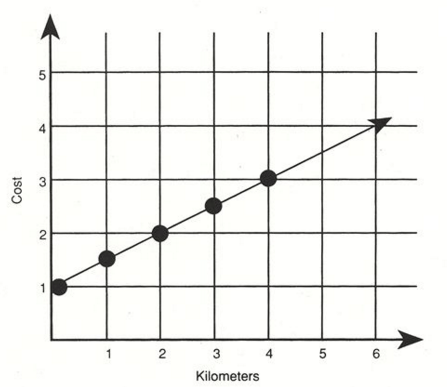
Why does this graph show a non-proportional relationship?

1

It doesn't, it is proportional because it is a straight line

2

It goes through the origin

3

It does not go through the origin

4

It is a straight line

4

Multiple Choice

Which equation represents a proportional relationship?

1

y = x + 3

2

y = x - 9

3

y = 7x

4

y = 4x + 1

5

Multiple Choice

Question image
What is the unit rate for the rain fall?
1
2 cm per hour
2
1 cm per hour
3
1/2 cm per hour
4
4 cm per hour

6

Multiple Choice

Question image

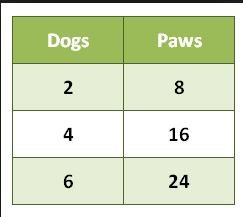
Which statement best describes the relationship between x (dogs) and y(paws) in the table?

1

Proportional

2

Not Proportional

7

Multiple Choice

Question image
Which table shows a proportional relationship?
1
A
2
B
3
C
4
D

8

Multiple Choice

Which relationship is an example of a proportional function?
1
a rental company charges $80 per day and a one-time fee of $24
2
a taxi ride costs $2 for the first mile and $4 for each additional mile
3
a gym membership cost $30 per month and an additional annual registration fee of $75
4
Beverly earns $210 a week for 4 weeks

9

Multiple Choice

Question image
Is the graph proportional or non proportional?
1
proportional
2
non proportional

10

Multiple Choice

Question image
Does this graph represent a proportional relationship?  
1
No, because it doesn't pass through the origin.
2
Yes, because it doesn't pass through the origin.
3
Yes, because it intersects the y axis.
4
No, because it intersects the x axis.

11

Multiple Choice

A mail carrier travels at 15 miles per hour through a neighborhood. Which table represents the distance the mail carrier travels in x hours?

1
2
3
4

12

Multiple Choice

Which of the following best represents a linear proportional relationships?

1
2

 y=3x7y=3x-7  

3

 y=8x+25y=8x+25  

4

13

Write Equations & Inequalities

Look for key words

Slide image

14

Multiple Choice

Peppy Pets charges a flat fee of $15 plus $3 per hour to keep a dog during the day. Happy Hounds charges a flat fee of $21 plus $1 per hour. For how many hours is the total fee charged by the companies the same?
1
2 hours
2
3 hours
3
4 hours
4
5 hours

15

Multiple Choice

Which situation can be represented by the equation 
1500 - 50x = 2000 - 100x
1
There are two water tanks in the city.  One tank has 1500 gallons and gains 50 gallons each hour.  The other tank has 2000 gallons and gains 100 gallons each hour.  When will the tanks have the same amount of water?
2
There are two water tanks in the city.  One tank has 1500 gallons and loses 50 gallons each hour.  The other tank has 2000 gallons and gains 100 gallons each hour.  When will the tanks have the same amount of water?
3
There are two water tanks in the city.  One tank has 1500 gallons and loses 50 gallons each hour.  The other tank has 2000 gallons and loses 100 gallons each hour.  When will the tanks have the same amount of water?
4
There are two water tanks in the city.  One tank has 1500 gallons and loses 50 gallons each hour.  The other tank has 2000 gallons and loses 100 gallons each hour.  When will the bigger tank have more water?

16

Multiple Choice

Question image
Which situation can be represented by the equation
40x
+ 20 = 200?
1
Mitch owed Jason $200. Mitch borrowed $20 more. If Mitch pays Jason back $40 per week, how many weeks will it take him to pay back the money?
2
Mitch owed Jason $200. Mitch already paid Jason back $20. If Mitch pays Jason back $40 per week, how many weeks will it take him to pay back the money?
3
Mitch owed Jason $200. Mitch borrowed $40 more. If Mitch pays Jason back $20 per week, how many weeks will it take him to pay back the money?
4
Mitch owed Jason $200. Mitch already paid back $40. If Mitch pays Jason back $20 per week, how many weeks will it take him to pay back the money?  

17

Multiple Choice

Question image
Which situation can be represented by the inequality
15 + 6x ≤ 100?
1
Lazer Zone charges $15 plus $6 per person. If Andrea has a maximum of $100 to spend, how many people can Andrea invite to play laser tag?
2
Lazer Zone charges $6 plus $15 per person. If Andrea has a maximum of $100 to spend, how many people can Andrea invite to play laser tag?
3
Lazer Zone charges $15 plus $6 per person. If Andrea has a minimum of $100 to spend, how many people can Andrea invite to play laser tag?
4
Lazer Zone charges $6 plus $15 per person. If Andrea has a minimum of $100 to spend, how many people can Andrea invite to play laser tag?

18

Multiple Choice

Alexa has at most $60 to spend on the clothes. She wants to buy a pair of jeans for $22 and spend the rest on t-shirts. Each t-shirt cost $8. Write an inequality that could be used to find x, the number of t-shirts Alexa can buy.

1

60≥22x-8

2

22-8x≥60

3

22x+8≤60

4

22+8x≤60

19

Multiple Choice

Juan bought a soda for $2. He also bought some nachos for $3 each. Juan did not spend more than $14 on the nachos and the soda. Write an inequality can be used to find n, the number of nachos that Juan could have bought.

1

14 ≥ 2n+3

2

2+3n ≤ 14

3

14-3n ≤ 2

4

14x+2 ≤ 3

20

Multiple Choice

The members of Indian Spring Middle School's cheerleaders need to raise at least $2000 to attend their national competition. They raised $300 with their last fundraiser and decide to host a school talent show to raise the rest. They plan to charge $10 for each ticket. Which inequality shows the number of tickets they must sale to reach their goal?

1

300x + 10 ≥ 2000

2

10x + 300 ≤ 2000

3

10x + 300 > 2000

4

300 + 10x ≥ 2000

21

Multiple Choice

The vet told Casey that her dog should weigh at most 70 lbs. Her dog weighs 106 pounds, so Casey set a goal that he would lose 4 pounds per week. Which inequality represents the number of weeks it take for Casey's dog to reach 70 lbs?
1
106 - 4x ≤ 70
2
70 + 4x ≤ 106
3
4x - 106 ≥ 70
4
106 - 4x< 70

22

Multiple Choice

The temperature in the ice rink must stay below 50°F. This morning, the temperature was 71°F. The ice rink runs a cooling device that can decrease the temperature by 3.5° every hour. Which inequality shows how long it will take for the temperature to fall below 50°F?
1
50 + 3.5x < 71
2
71 - 3.5x < 50
3
71 - 3.5x ≤ 50
4
71 + 3.5x < 50

23

Linear Multiple Representations

This is an example from class earlier in the school year

Slide image

24

Linear Multiple Representations

Watch the video on the next slide to review the relationships between each of the representations.

Slide image

25

26

Multiple Choice

Question image

Melanie opened her savings account with $50. Each month, Melanie deposited the same amount of money into the account. She recorded the balance of her savings account in a table.

Which equation represents t, the total amount of money in Melanie's savings account at the end of m months?

1

t = 50m + 50

2

t = 100m + 50

3

t = 150m + 50

4

t = 75m + 50

27

Multiple Choice

Which of the following graphs is represented by the linear equation:

y = 2/3x + 1?

1
2
3
4

28

Multiple Choice

Look at the equation below.

y = 2x - 2. Which situation is best described by the equation?

1

The temperature at 2:00 AM is 2°C and rises 2° each hour for x hours.

2

The temperature at 2:00 AM is 2°C and drops 2° each hour for x hours.

3

The temperature at 2:00 AM is -2°C and rises 2° each hour for x hours.

4

The temperature at 2:00 AM is -2°C and drops 2° each hour for x hours.

29

Multiple Choice

Which description is best represented by the equation shown below?

y = 7.5x - 3

1

Marissa ran 7.5 miles in 3 hours. How many miles did Marissa run per hour?

2

Anthony paid $7.50 an hour to skate for 3 hours. What was Anthony's total cost?

3

Kelsie earns $3 an hour walking Mrs. Tan's dog. She walks the dog 7.5 hours each week. How much did Kelsie earn last week?

4

Benji spent $3 on art supplies. He sells paintings for $7.50 each. What is Benji's profit?

30

Slide image

Types of Trends in Scatter Plots

31

Multiple Choice

If a scatterplot has no correlation then...
1
...it has no ordered pairs
2
...it has ordered pairs that have a negative pattern
3
...its ordered pairs have no predictable pattern
4
...if it makes a lion on a graph (roar!)

32

Multiple Choice

Question image
Which scatter plot shows a linear relationship between x and y?
1
Graph A
2
Graph B
3
Graph C
4
Graph D

33

Multiple Choice

Question image

Which scatter plot has a stronger association? How do you know?

1

Scatter plot A; the points of data are closer together.

2

Scatter plot B; the points of data are not close together.

34

Multiple Choice

Mrs. Dominick’s class did a survey about the number of chores students did and the amount of allowance that student earned. Bryan thinks the association is negative

because they found that as the number of chores decreased, the amount of allowance also decreased. Is Bryan correct? Explain.

1

Bryan is correct; if the variables move together, then the association

is negative.

2

Bryan is incorrect; if the variables move together, then the association is positive.

35

Multiple Choice

Question image

Which best describes the association shown in the scatter plot below?

1

Negative and linear

2

Negative and non-linear

3

Positive and linear

4

Positive and non-linear

36

Multiple Choice

Which scatter plot(s) could be used to show the relationship between a person’s age and a person’s height?

1
2
3
4

37

Multiple Choice

Question image

Label the type of association shown by the scatter plot as positive, negative or none.

1

positive

2

negative

3

none

38

Multiple Choice

Question image

Label the type of association shown by the scatter plot as positive, negative or none.

1

positive

2

negative

3

none

39

Multiple Choice

Jules conducted a survey and asked 100 people how many years of education they have and what their annual income is. She used the results to make a scatter plot.


What type of association should he expect to see in the scatter plot?

1

positive association

2

negative association

3

no association

40

Multiple Choice

Question image

Label the type of association shown by the scatter plot as positive, negative or none.

1

positive

2

negative

3

none

41

Multiple Choice

Question image

Label the type of association shown by the scatter plot as positive, negative or none.

1

positive

2

negative

3

none

42

Multiple Choice

A submarine started the day at sea level and then descended at a rate of 1,200 feet per hour. The equation y = -1200x can be used to determine the depth of the submarine.


Which table contains a set of values that correspond to the equation?

1
2
3
4

43

Multiple Choice

Question image

Which description corresponds to the relationship shown in the table?

1

Earning $8 per hour plus $10 in tips.

2

Earning $10 per hour.

3

Earning $7 per hour plus $15 in tips.

4

Earning $8.50 an hour.

44

Trend Lines

Make Predictions

Slide image

45

Multiple Choice

Question image
The scatter plot shows the relationship between the number of chapters and the total number of pages for several books.  Use the trend line to predict how many chapters would be in a book with 180 pages. 
1
12 chapters
2
15 chapters
3
18 chapters
4
21 chapters

46

Multiple Choice

Question image
If the carpenter worked for 6 days, how much did he earn?
1
1250
2
1500
3
1750
4
2000

47

Multiple Choice

Question image
If the debate team plans to practice for 6 hours, how many debates should they win?
1
20
2
16
3
24
4
28

48

Multiple Choice

Question image
Mrs. Collins made a scatterplot to show the relationship between the number of absences and a student’s final exam score. Based on this scatterplot, a student with 6 absences should get approximately what score on the final exam? 
1
85
2
92
3
70
4
76

49

Multiple Choice

Question image

The following scatter plot shows Pam's training as she prepares to run a 6 mile race at the end of the month. Which of the following would be a reasonable approximation for the length of time it would take for her to run 6 miles?

1

A. 50 min

2

B. 80 min

3

C. 45 min

4

D. 60 min

50

System of Equations

Point of Intersection

Slide image

51

Multiple Choice

Question image
What is the solution to this system?
1
(1, -1)
2
(-1, 1)
3
(0, -2)
4
(2, 0)

52

Multiple Choice

Question image
Identify the solution to the system using the graph.
1
(0,0)
2
(1,1)
3
(2,2)
4
(3,3)

53

Multiple Choice

Question image
Buzz graphed two lines in order to find the solution to a given system of equations.
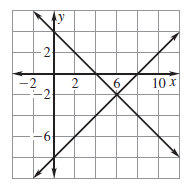
What is the solution?
1
(-1, 4)
2
(1, -4)
3
(-4, 1)
4
(4, -1)

54

Multiple Choice

Question image
What is the solution to the system?
1
(3, -1)
2
(2, -6)
3
No Solution 
4
(6, -2)

55

Poll

After completing this Review Pre-Assessment, which of the following topics would you like a live review on?

Proportional vs Non-Proportional

Writing Equations & Inequalities

Multiple Representations

Scatter Plots & Trend Lines

Solving Systems by Graphing

4/19 Week 2 Review Pre-Assessment

What do we need to review?

Slide image

Show answer

Auto Play

Slide 1 / 55

SLIDE