
Data and Statistics Test Review
Presentation
•
Mathematics
•
7th Grade
•
Medium
+4
Standards-aligned

Raeanna Randolph
Used 19+ times
FREE Resource
6 Slides • 29 Questions
1
Data and Statistics Test Review

2
3
Multiple Choice
4
Multiple Choice
5
Multiple Choice
6
Multiple Choice
7
Multiple Choice
8
9
Multiple Choice
10
Multiple Choice
11
Multiple Choice
12
Multiple Choice
13
Multiple Choice

Find the Mean Absolute Deviation: 5, 11, 2, 7, 16. The Mean is 8.2
14
15
Multiple Choice

What is the interquartile range (IQR)?
16
Multiple Choice
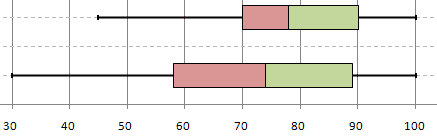
Which box and whisker plot has the highest median?
17
Multiple Choice

18
Multiple Choice

What is the minimum value?
19
Multiple Choice

What value is the lower quartile?
20
21
Multiple Choice
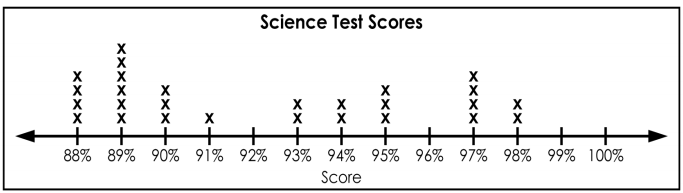
22
Multiple Choice

What is the difference between the highest score and the lowest score on the test?
23
Multiple Choice
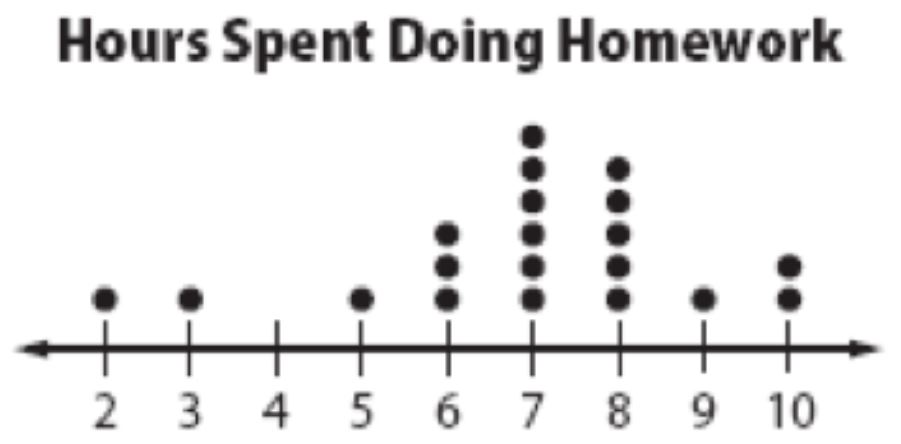
How many students spent 7 hours doing homework that week?
24
25
Multiple Choice

The double dot plot shows the number of city pet registrations for several days.
26
Multiple Choice
27
Multiple Choice
28
Multiple Choice
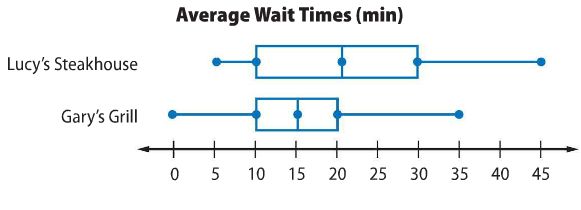
Which restaurant has a higher median wait time?
29
Multiple Choice

Which has a greater interquartile range?
30
Multiple Choice

Which car club has the higher median?
31
Multiple Choice

What is the IQR of the Cruisers?
32
Multiple Choice

33
Multiple Choice

34
Multiple Choice

The double dot plot shows the gas mileage, in miles per gallon, for several cars and SUVs.
35
Multiple Choice
The double dot plot shows the gas mileage, in miles per gallon, for several cars and SUVs.
Data and Statistics Test Review
Show answer
Auto Play
Slide 1 / 35
SLIDE
