Search Header Logo
  1. Resource Library
  2. Math
  3. Probability And Statistics
  4. Measures Of Center
  5. Measures Of Center
Measures of Center

Measures of Center

Assessment

Presentation

Mathematics

8th - 12th Grade

Medium

CCSS
6.SP.B.5D, 6.SP.B.5C, HSS.ID.A.2

Standards-aligned

Created by

Rachel Rohan

Used 22+ times

FREE Resource

40 Slides • 17 Questions

1

Take 1 minute to get scrap paper/pencil or whiteboard/marker

media

2

media

3

media

4

media

5

Multiple Choice

Question image

Describe the histogram. Tap to enlarge image.

1

Left Skewed

2

Normal/Symmetrical

3

Right Skewed

6

Multiple Choice

Question image

What is the overall shape of the graph? Tap to enlarge image.

1

Normally Distributed

2

Skewed left

3

Skewed right

7

Multiple Choice

Question image

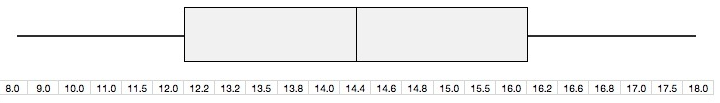
How would you describe this distribution? Tap to enlarge image.

1

Left skewed

2

Symmetrical/normal

3

Right Skewed

8

Multiple Choice

Question image

What is the shape of this data? Tap to enlarge image.

1

symmetric/normal

2

skewed left

3

skewed right

9

media

10

media

11

Fill in the Blank

Find the MEAN of 76, 68, 72, 70, 77, 73. Use a calculator.


Round to the nearest hundreth (2 decimal places)

12

media

13

media

14

media

15

Fill in the Blank

Find the MEDIAN of 68, 70, 72, 73, 76, 77.


Write the exact answer.

16

media

17

media

18

media

19

media

20

Multiple Choice

When the data is normally distributed, the mean and the median are:

1

about the same

2

far away from each other

21

Multiple Choice

According to the notes, which measure of center should be used when the data is mostly symmetrical/normal?

1

mean

2

median

22

media

23

media

24

media

25

Fill in the Blank

Find the MEAN of 76, 45, 72, 70, 77, 73. Use a calculator.


Round to the nearest hundreth (2 decimal places)

26

media

27

media

28

media

29

Fill in the Blank

Find the MEDIAN of 45, 70, 72, 73, 76, 77.


Write the exact answer.

30

media

31

media

32

media

33

media

34

Multiple Choice

According to the notes, which measure of center should be used when the data is skewed?

1

mean

2

median

35

media

36

media

37

Multiple Choice

Question image

This data is...

1

approximately normal

2

skewed left (left tail)

3

skewed right (right tail)

38

media

39

media

40

media

41

media

42

Multiple Choice

From the previous slide, which measure of center was more affected/changed by the outlier?

1

mean

2

median

43

media

44

Multiple Choice

According to the notes, which measure of center should be used when the data is skewed?

1

mean

2

median

45

media

46

media

47

media

48

Multiple Choice

Question image

Which measure of center would be better?

1

MEAN because it is NORMAL

2

MEAN because it is SKEWED

3

MEDIAN because it is NORMAL

4

MEDIAN because it is SKEWED

49

media

50

media

51

Multiple Choice

Question image

Which measure of center would be better?

1

MEAN because it is NORMAL

2

MEAN because it is SKEWED

3

MEDIAN because it is NORMAL

4

MEDIAN because it is SKEWED

52

media

53

media

54

Multiple Choice

Question image

Which measure of center would be better?

1

MEAN because it is NORMAL

2

MEAN because it is SKEWED

3

MEDIAN because it is NORMAL

4

MEDIAN because it is SKEWED

55

media

56

media

57

media

Take 1 minute to get scrap paper/pencil or whiteboard/marker

media

Show answer

Auto Play

Slide 1 / 57

SLIDE