
Exponential Functions
Presentation
•
Mathematics
•
9th - 12th Grade
•
Hard
+2
Standards-aligned

Susan Joyce
Used 7+ times
FREE Resource
22 Slides • 11 Questions
1
Exponential Functions
The number of cases of the corona virus represents an exponential function

2
What is an exponential function?
A function in which the variable is an exponent
Non-linear
Rate of change is not constant over every interval
Formula is f(x) = , where a 0, and b >0, and b 1

3

4
How do you make a table of values for an exponential function?
The x-values in your table will be the numbers that you substitute for the exponent "x"
The y-values are the values of the base raised to the power of "x" times the coefficient. Sometimes the "a" value, or coefficient is of the base "b" is 1, like in the example

5

6

7

8
9
Key Features of an Exponential Functions
the domain is all Real numbers.
the range is all positive real numbers (not zero).
graph has a y-intercept at (0,1). Remember any number to the zero power is 1.
when b > 1, the graph increases. The greater the base, b, the faster the graph rises from left to right.

10
when 0 < b < 1, the graph decreases.
has an asymptote (a line that the graph gets very, very close to, but never crosses or touches). For this graph the asymptote is the x-axis (y = 0).
graph passes the vertical line test for functions
graph passes the horizontal line test for functional inverse.
graph is asymptotic to the x-axis - gets very, very close
https://mathbitsnotebook.com/Algebra2/Exponential/EXExpFunctions.html

11
Y Intercepts
y-intercept is when x = 0
When the equation is y = bx, then the y intercept is 1 (when x=0, any number to the 0 power is 1)
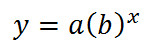
When the equation is y = a(b)x, then the y-intercept is a(b)0 = a(1) or a

12
Y-Intercept
When the equation is y = a(b)x+h +/- k, then the y-intercept is when x = 0, or "a" (b)h +/- k
In the example, f(x) = 2x+1 - 3. When x = 0, it is 20+1 - 3, or 2-3 = -1.
The y-intercept is (0, -1)

13
X-intercepts/Asymptotes
The x-intercept occurs when y = 0
When the equation is f(x) = , then there is no x intercept, since a 0, and there is no value of x that will make = 0
Instead, the graph will approach a horizontal line called an asymptote

14
X-intercept
If the graph looks like -k, then the x-intercept can be found by setting f(x) = 0
0 = 4 ( )- 100
100 = 4 ( ) (add 100 to both sides)
25 =
5^2 = 5^x, 2 = x = x-intercept

15
X-intercept
If the equation looks like f(x) = a (b)x + k, we try to solve for the x-intercept by setting y = 0
f(x) = 4(5)x + 100
0 = 4(5)x + 100
-100 = 4 (5)x (subtract 100)
-25 = 5x (divide by 4)
There is no x-intercept for this function since there is no value of x that will give me a negative number
This equation has an asymptote at y = 100

16

17
Asymptotes
If the equation looks like + k, where k=0, then the asymptote is y = 0.
If the equation looks like , where k 0, then the asymptote is y = k.

18
Rate of Change
Linear functions have a constant rate of change
No matter which pair of points you choose, the rate of change (slope) is the same
Exponential functions do not have a constant rate of change, so rate of change is defined for a special interval (values for x)

19
Rate of Change
Rate of change would be defined between two x-values.
To find the rate of change, determine the y-values or output for the given x-values
Use the slope formula to find the rate of change between those two points

20

21
End Value When (b) > 1 (exponential growth )
y--> horizontal asymptote
As x gets bigger, y gets bigger
As x gets smaller,
y --> horizontal asymptote

22
End Value When 0< b <1
When x --> + , y ---> horizontal asymptote
When x --> , y --> +
As x gets bigger, y approaches some value but never gets there
As x gets smaller, y approaches + infinity

23
Multiple Choice

What is the range of this graph?
Hint: The range is the set of y-values.
24
Multiple Choice

Is the table linear, exponential, or neither?
Hint: Do the consecutive y values add the same number, or multiply by the same number?
25
Multiple Choice

Is the table linear, exponential, or neither?
Do the consecutive y values add the same number, or multiply by the same number?
26
Multiple Choice
27
Multiple Choice
28
Multiple Choice

29
Multiple Choice
30
Multiple Choice
31
Multiple Choice

What is the y-intercept of the function?
32
Multiple Choice
33
Multiple Choice
In an exponential function, what does the 'a' represent?
Exponential Functions
The number of cases of the corona virus represents an exponential function
Show answer
Auto Play
Slide 1 / 33
SLIDE
