

Unit 19 Interpreting and discussing results

Presentation
•
Mathematics
•
6th Grade
•
Medium

Juvy Obonan
Used 25+ times
FREE Resource
1 Slide • 20 Questions
1
Unit 19 Interpreting and discussing results
*Interpreting and drawing
-pictograms
-bar charts
-bar-line graphs
-frequency diagrams
-pie chart
*Drawing conclusions

2
Multiple Choice

How many employees travelled by car to work?
3
Multiple Choice
What was the most common mode of transport?
4
Multiple Choice

When was the greatest amount of shoppers at the store?
5
Multiple Choice

What is the maximum number of computers that someone said they had?
6
Multiple Choice

How many times was the number 3 rolled?
7
Multiple Choice

How many birds are represented by the green sector?
8
Multiple Choice

9
Multiple Choice
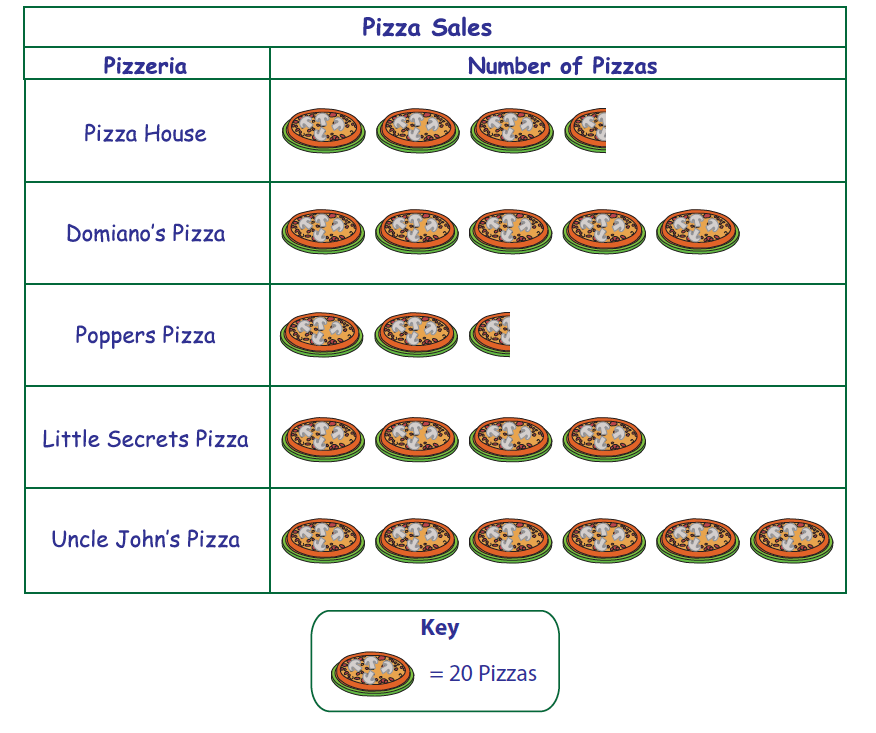
How many more pizzas were sold by Uncle John's Pizza than Little Secrets Pizza?
10
Multiple Choice

What percent of the annual sales were washers?
11
Multiple Choice

pie chart shows how a group of pupils travel to school.
how many pupils go to school by bus?
12
Multiple Choice

13
Multiple Choice

the pie chart shows the different types of vehicles involved in road accidents in a city last years.
which type of vehicles had the highest number of road accidents last year?
14
Multiple Choice
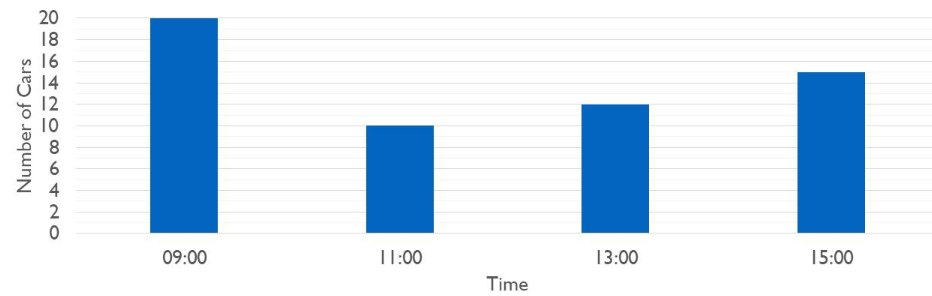
How many more cars pass at 15:00 than at 11:00?
15
Multiple Choice
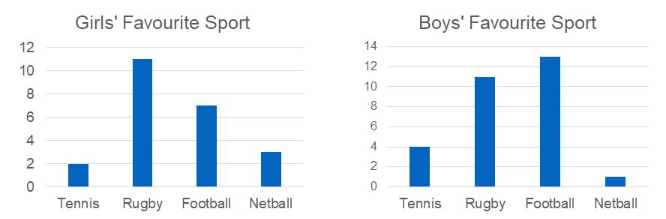
Which sport was picked by the same number of girls and boys?
16
Multiple Choice
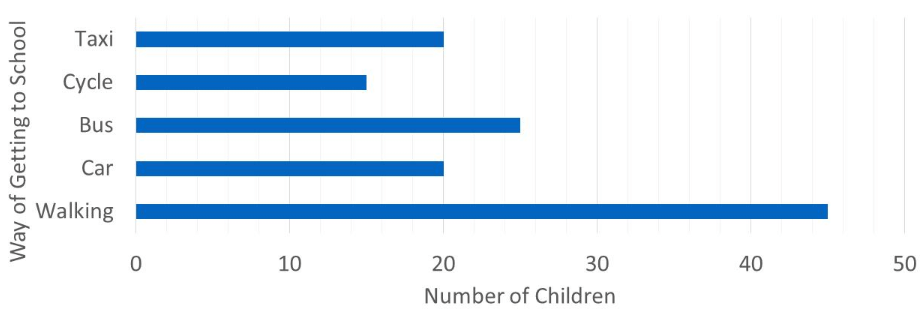
How many more children walk than take the bus to school?
17
Multiple Choice
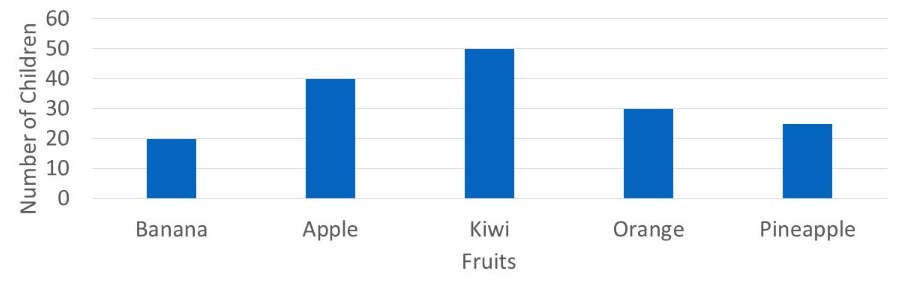
Which of the following statements is true?
18
Multiple Choice
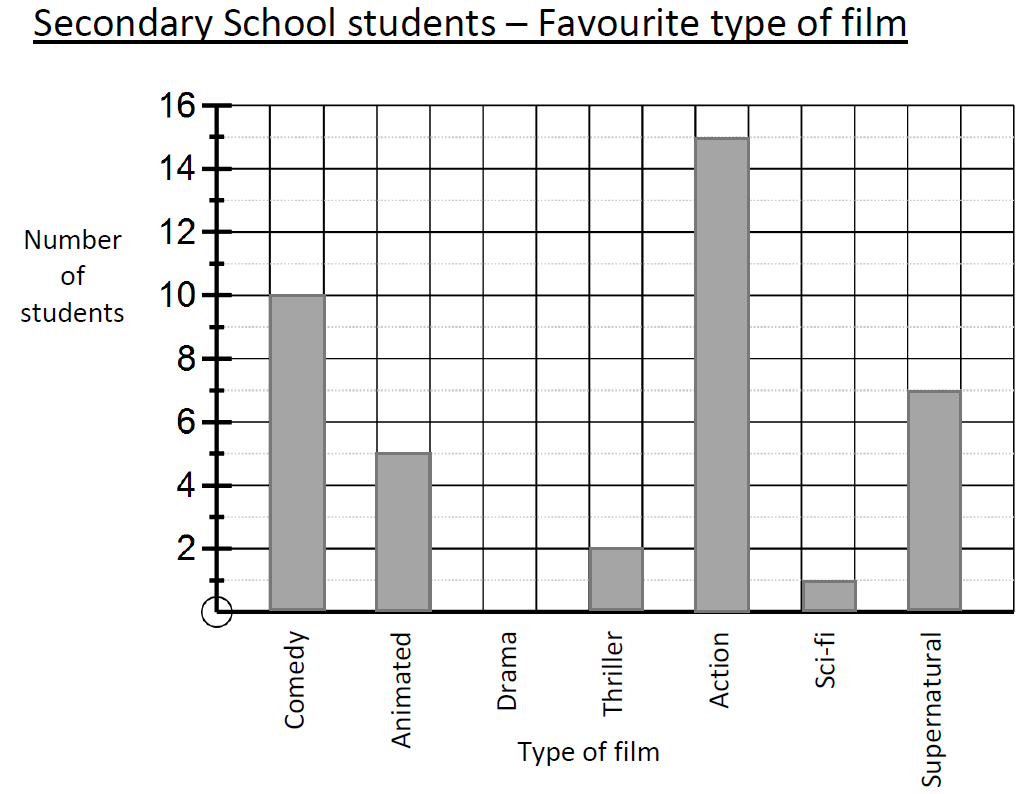
How many people said Drama was their favourite type of film?
19
Multiple Choice
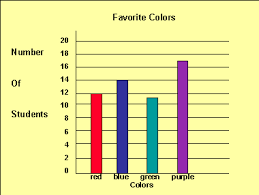
How many more people have purple for a favourite colour than red?
20
Multiple Choice

How many bicycles were sold?
21
Multiple Choice
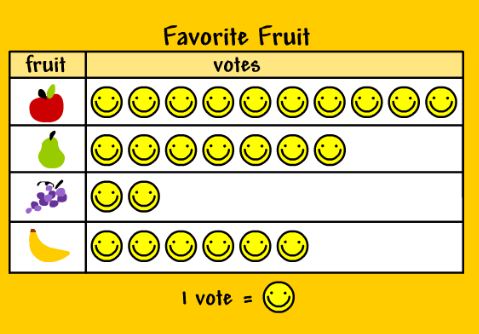
How many fruits are there in total?
Unit 19 Interpreting and discussing results
*Interpreting and drawing
-pictograms
-bar charts
-bar-line graphs
-frequency diagrams
-pie chart
*Drawing conclusions
Show answer
Auto Play
Slide 1 / 21
SLIDE

