
Linear Regression
Presentation
•
Mathematics
•
9th Grade
•
Medium
+3
Standards-aligned

Michael Williams
Used 231+ times
FREE Resource
4 Slides • 10 Questions
1
Linear Regression

2
Why linear regression?
Use linear regression to predict the outcome of a progression using a given set of data.

3
Multiple Choice

Write the equation for the linear regression shown.
4
Multiple Choice
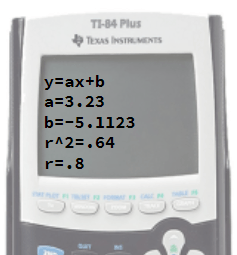
Write the equation for the linear regression shown.
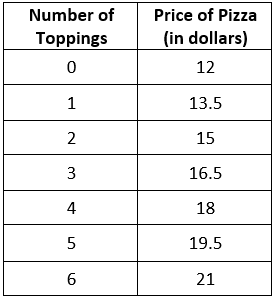
5
Example #2
Click on STAT
Click on Edit
Enter the data into L1 and L2
Click STAT, then right to CALC
Scroll down to LinReg(ax+b)
Click Enter, then Enter again

6
Example #3
Click on STAT
Click on Edit
Enter the data into L1 and L2
Click STAT, then right to CALC
Scroll down to LinReg(ax+b)
Click Enter, then Enter again

7
Multiple Choice
8
Multiple Choice

9
Multiple Choice

What is the line of best fit?
10
Multiple Choice

11
Multiple Choice
12
Multiple Choice

13
Multiple Choice

14
Multiple Choice

Linear Regression
Show answer
Auto Play
Slide 1 / 14
SLIDE
