Search Header Logo
HISTORY/GEOGRAPHY: VISUAL DATA LESSON

HISTORY/GEOGRAPHY: VISUAL DATA LESSON

Assessment

Presentation

History, Social Studies, Geography

7th - 8th Grade

Easy

Created by

G Wells

Used 1+ times

FREE Resource

8 Slides • 5 Questions

1

HISTORY/GEOGRAPHY: VISUAL DATA LESSON

MODULE 1 VOCABULARY

Slide image

2

Slide image

3

Slide image

4

Multiple Choice

Question image

What cardinal direction goes in the yellow box?

1

east

2

west

3

south

4

north

5

Slide image

6

Multiple Choice

Question image

How many miles would 9 inches be on this map?

1

10

2

20

3

30

4

90

7

Slide image

8

Multiple Choice

Question image

What does this symbol mean?

1

Church

2

Restaurant

3

School

4

Park

9

Slide image

10

Multiple Choice

Question image
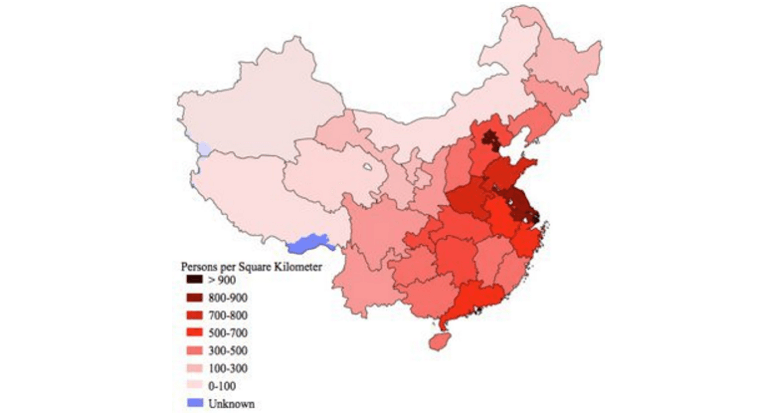
Which of these best explains the high population density in China's eastern region?
1
The region is not capable of supporting large scale farming
2
The region is close to the ocean and has favorable climate
3
The region is home to the emperor 
4
The region is located near active volcanoes

11

Slide image

12

Multiple Choice

What type of map focuses on state boundaries?

1

Physical Map

2

Political Map

13

Slide image

NICE WORK!

HISTORY/GEOGRAPHY: VISUAL DATA LESSON

MODULE 1 VOCABULARY

Slide image

Show answer

Auto Play

Slide 1 / 13

SLIDE