
Scatter Plots 2
Presentation
•
Mathematics
•
8th Grade
•
Easy
+11
Standards-aligned

Kevvin Hankins
Used 9+ times
FREE Resource
8 Slides • 19 Questions
1

2
Multiple Choice

3
Multiple Choice
4
Multiple Choice

5
Multiple Choice

6
Multiple Choice

7
Multiple Choice

8
Multiple Choice
9
Multiple Choice

10
Multiple Choice

The following scatter plot shows Pam's training as she prepares to run a 6 mile race at the end of the month. Which of the following would be a reasonable approximation for the length of time it would take for her to run 6 miles?
11
Open Ended
12
Multiple Choice
The following scatter plot shows Pam's training as she prepares to run a 6 mile race at the end of the month. Which of the following would be a reasonable approximation for the length of time it would take for her to run 6 miles?
13

14
15

16

17

18

19

20
Multiple Choice

Based on the graph, if Joe earned $400, how many hours did he work?
21
Multiple Choice

Mrs. Collins made a scatterplot to show the relationship between the number of absences and a student’s final exam score. Based on this scatterplot, a student with 6 absences should get approximately what score on the final exam?
22
Multiple Choice

The scatter plot shows the relationship between the number of chapters and the total number of pages for several books. Use the trend line to predict how many pages would be in a book with 19 chapters.
23
Multiple Choice

What type of correlation does this scatter plot show?
24
Multiple Choice

Which sentence describes the relationship shown on this scatter plot?
25
Multiple Choice
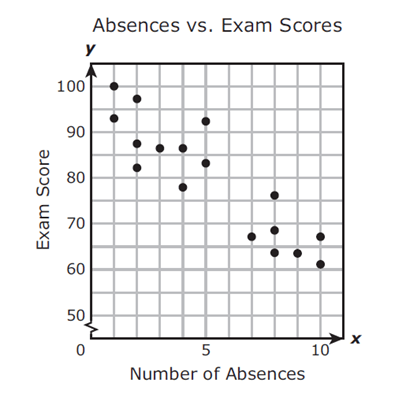
Mrs. Collins made a scatterplot to show the relationship between the number of absences and a student’s final exam score. Based on this scatterplot, a student with 12 absences should get approximately what score on the final exam?
26
Multiple Choice

What type of correlation does this graph have?
27
Multiple Choice
What type of correlation does this graph have?
Show answer
Auto Play
Slide 1 / 27
SLIDE
