
Line Graphs
Presentation
•
Mathematics
•
5th - 12th Grade
•
Medium
+9
Standards-aligned
Kelly Downs
Used 30+ times
FREE Resource
8 Slides • 27 Questions
1
Line Graphs
by Kelly Downs
2
3
4
5
6
7
8
Multiple Choice
What is the name of this graph?
Time Plot
Line Graph
Time Series
All of these
9
Multiple Choice
What is the main purpose of a line graph?
to compare two things
to show trends over time
to have an independent variable
so you don't have to read words
10
Multiple Choice
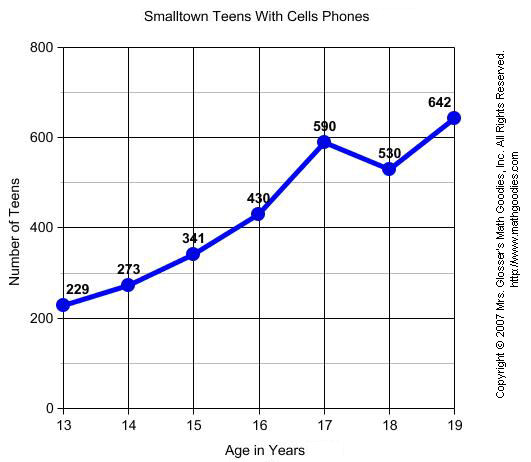
What label is along the y-axis in this graph?
Copyright 2007
Lines
Age in Years
Number of Teens
11
Multiple Choice
What is the general trend of this line graph?
The more you mow, the less money you make.
You make the same amount of money regardless of how long you mow.
The more you mow, the more money you make.
Mowing is dangerous.
12
Multiple Choice
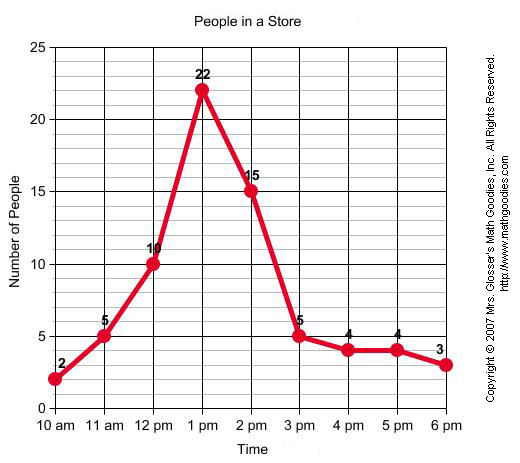
At what time were the greatest amount of shoppers at the store?
10am
1pm
6pm
2pm
13
Multiple Choice
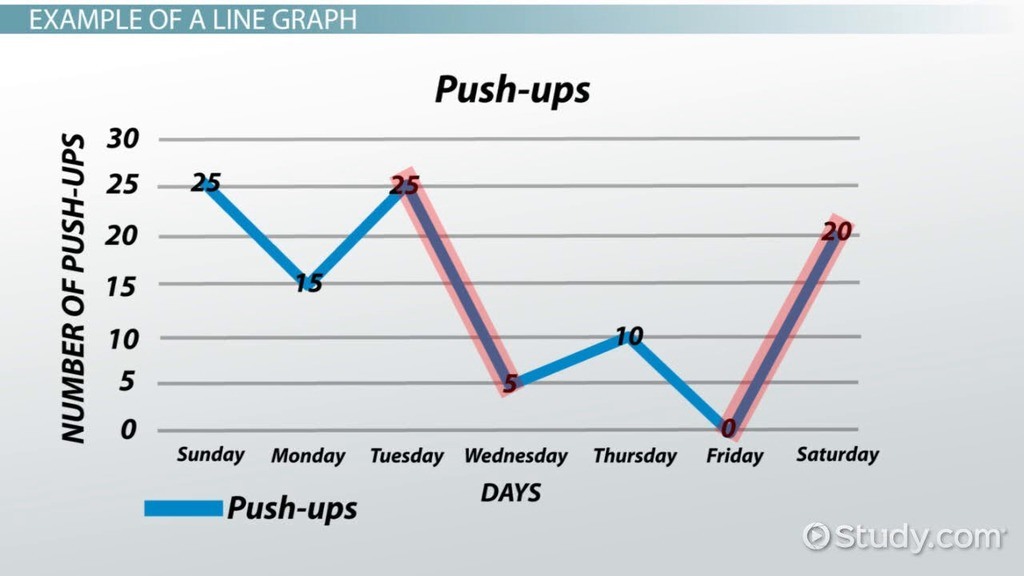
Between which two days was the greatest decrease in push-ups?
Friday and Saturday
Tuesday and Wednesday
Sunday and Monday
Thursday and Friday
14
Multiple Choice
What was the bear population in 2001?
40,000
50
50,000
5
15
Multiple Choice
Between which two years did the bear population remain constant or the same?
2004 and 2005
2001 and 2002
2005 and 2006
2000 and 2001
16
Multiple Choice
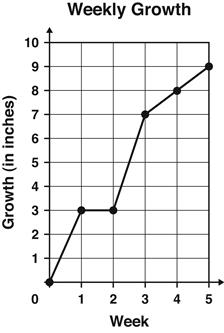
The graph shows the number of inches a plant grew each week.
Between which 2 weeks did the plant grow the MOST?
Week 1 and Week 2
Week 2 and Week 3
Week 3 and Week 4
Week 4 and Week 5
17
Multiple Choice
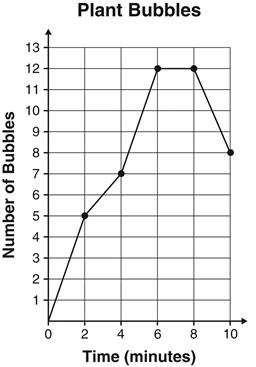
During an experiment, students counted the number of bubbles given off by water plants every 2 minutes during a 10-minute period. The results are graphed below.
At which two times were the same number of bubbles given off?
2 and 4 minutes
4 and 6 minutes
6 and 8 minutes
8 and 10 minutes
18
Pearson Time Series
Review
​
19
Multiple Choice
0.32
0.24
0.10
0.06
20
Multiple Choice
The graph shows the number of cars sold from January to April. How many more cars were sold in March than in January?
2,000
5,000
7,000
8,000
21
Multiple Choice
22
Multiple Choice
What percentage of the houses are semi-detached?
60%
40%
33%
23
Multiple Choice
This plot show how many point was scored on a video game. What is the difference between the greatest and least amount of point scored?
4.8
38
3.8
84
24
Multiple Choice
This plot represents the number of cookies eaten at a county fair for 10 different days. What percentage of the days did people eat more than 90 cookies?
30%
50%
40%
4%
25
Multiple Choice
This plot represent the number of cookies eaten at a county fair. What is the shape of the distribution?
Skewed Left
Symmetric
Skewed Right
Uniform
26
Multiple Choice
Which type of graphs should be used for categorical data?
Dot plots & bar graphs
Pie Charts & Dot plots
Bar graphs and Stem & Leaf plots
Bar Graphs and Pie Charts
27
Multiple Choice
What type of graphs should be used for small sets of quantitative data?
Stem & Leaf Plots and Dot Plots
Histograms and Pie Charts
Bar Graphs and Pie Chart
Dot Plots and Bar Graphs
28
Multiple Choice
The mass of the chocolate cake is 250 g.
qualitative
quantitative
29
Multiple Choice
30
Multiple Choice
31
Multiple Choice
32
Multiple Choice
Identify the kind of variable in this situation:
length of time a football play lasts
discrete
continuous
33
Multiple Choice
34
Multiple Choice
The number of oranges produced by my orange tree each year is continuous data:
True
False
35
Multiple Choice
Which of theses is NOT continuous data:
A person's height each year
Cars finished in a factory each day
The volume of water in a swimming pool each day
A person weight on each birthday
Line Graphs
by Kelly Downs
Show answer
Auto Play
Slide 1 / 35
SLIDE
Similar Resources on Wayground
28 questions
lines and angles 1 g5
Presentation
•
5th Grade - University
29 questions
Lab Safety Is Common Sense
Presentation
•
KG
26 questions
Mathematical Properties
Presentation
•
5th Grade - University
31 questions
ALJABAR
Presentation
•
KG
28 questions
What is Climate Change?
Presentation
•
5th - 12th Grade
30 questions
Order of Operations
Presentation
•
5th - 12th Grade
30 questions
Algebra I, Unit 2, Lesson 6 Notes
Presentation
•
9th Grade
31 questions
ser and adjectives
Presentation
•
6th - 12th Grade
Popular Resources on Wayground
10 questions
5.P.1.3 Distance/Time Graphs
Quiz
•
5th Grade
10 questions
Fire Drill
Quiz
•
2nd - 5th Grade
20 questions
Equivalent Fractions
Quiz
•
3rd Grade
22 questions
School Wide Vocab Group 1 Master
Quiz
•
6th - 8th Grade
20 questions
Main Idea and Details
Quiz
•
5th Grade
20 questions
Context Clues
Quiz
•
6th Grade
20 questions
Inferences
Quiz
•
4th Grade
12 questions
What makes Nebraska's government unique?
Quiz
•
4th - 5th Grade
Discover more resources for Mathematics
16 questions
Graphing - First Quadrant
Quiz
•
5th Grade
10 questions
Box Plots
Quiz
•
6th - 7th Grade
14 questions
Volume of rectangular prisms
Quiz
•
7th Grade
15 questions
Pythagorean Theorem Word Problems Quizizz
Quiz
•
8th Grade
22 questions
Simple Probability
Quiz
•
7th Grade
10 questions
U7L3 Power of Powers of 10
Quiz
•
8th Grade
20 questions
Graphing Inequalities on a Number Line
Quiz
•
6th - 9th Grade
20 questions
Box and Whisker Plots
Quiz
•
6th Grade