Search Header Logo
Line Graph and Dot Plot

Line Graph and Dot Plot

Assessment

Presentation

Mathematics

7th Grade

Medium

Created by

WINNIE Moe

Used 4+ times

FREE Resource

7 Slides • 14 Questions

1

Line Graph

by WINNIE Moe

​Monday 18/10/2021

2

media
media

​https://youtu.be/l61owCcnrPI

3

media

4

media
media

Step 1

media

5

​Step 2

media
media

6

​Step 3

media
media

7

​Step 4

media
media

8

Multiple Choice

Question image
What is the name of this graph?
1
line plot
2
line graph
3
bar graph
4
frequency table

9

Multiple Choice

Question image

A restaurant recorded the number of pizzas sold each month for one year. The data are shown in the graph below. During which month did the restaurant sell 40 pizzas?

1

March

2

May

3

July

4

August

10

Multiple Choice

Question image
When was the greatest amount of shoppers at the store?
1
10am
2
1pm
3
6pm
4
2pm

11

Multiple Choice

Question image
What was the bear population in 2001?
1
40
2
45
3
50
4
55

12

Multiple Choice

Question image

Use the line graph to complete the question below:


Which month has the lowest tempetature?

1

January

2

May

3

February

4

March

13

Multiple Choice

Question image

Use the line graph to complete the question below:


Which two days had the greatest increase?

1

Monday to Tuesday

2

Tuesday to Wednesday

3

Wednesday to Thursday

4

Thursday to Friday

14

Multiple Choice

Question image

According to the graph, is the plant height increasing, decreasing, or staying the same?

1

Increasing

2

Decreasing

3

Staying the same

15

Multiple Choice

Question image

At what rate did the temperature decrease between the 20th and 25th minutes of the experiment?

1

10°C in 5 min

2

10°C in 10 min

3

5°C in 5 min

4

5°C in 10 min

16

Multiple Choice

Question image

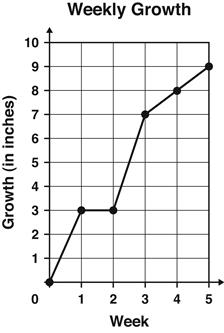
The graph shows the number of inches a plant grew each week.

Between which 2 weeks did the plant grow the MOST?

1

Week 1 and Week 2

2

Week 2 and Week 3

3

Week 3 and Week 4

4

Week 4 and Week 5

17

Multiple Choice

The X axis is _______?
1
vertical
2
diagonal
3
criss-cross
4
horizontal

18

Multiple Choice

The Y axis is _______?
1
Vertical
2
Horizontal
3
criss-cross
4
diagonal

19

Multiple Choice

Question image
What label is along the y-axis in this graph?
1
Copyright 2007
2
Lines
3
Age in Years
4
Number of Teens

20

Multiple Choice

Question image

In which month the sale increased

1

July

2

June

3

May

4

August

21

Multiple Choice

Question image

Which month did the restaurant sell 40 pizzas?

1

March

2

May

3

July

4

August

Line Graph

by WINNIE Moe

​Monday 18/10/2021

Show answer

Auto Play

Slide 1 / 21

SLIDE

Discover more resources for Mathematics