
Correlation Intro Part 2
Presentation
•
Mathematics
•
7th - 9th Grade
•
Easy
Standards-aligned

Zanier Fuller
Used 7+ times
FREE Resource
4 Slides • 29 Questions
1

2
3

4
Multiple Choice
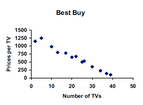
Describe the strength of the correlation
5
Multiple Choice

6
Multiple Choice

7
Multiple Choice

8
Multiple Choice

9
Multiple Choice

10
Multiple Choice

11

12
Multiple Choice
13
Multiple Choice
14
Multiple Choice

15
Multiple Choice
16
Multiple Choice
17
Multiple Choice
18
Multiple Choice
19
Multiple Choice
20
Multiple Choice
21
Multiple Choice
22
Multiple Choice
23
Multiple Choice
24
Multiple Choice
25
Multiple Choice
26
Multiple Choice
What type of correlation?
27
Multiple Choice

What type of Correlation?
28
Multiple Choice
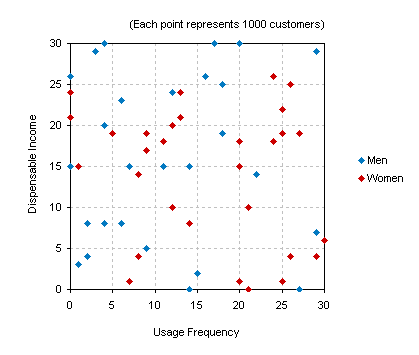
What type of Correlation?
29
Multiple Choice

What type of correlation does the graph show?
30
Multiple Choice
31
Multiple Choice

What type of correlation does the graph show?
32
Multiple Choice
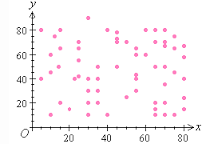
What type of correlation does this graph show?
33
Multiple Choice

Show answer
Auto Play
Slide 1 / 33
SLIDE
