
Bar Graphs
Presentation
•
Mathematics
•
3rd - 4th Grade
•
Medium
+3
Standards-aligned

Amber Byrd
Used 18+ times
FREE Resource
12 Slides • 16 Questions
1
2
Multiple Select
3
Multiple Choice
4
Multiple Choice

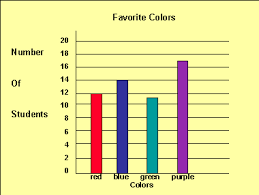
Name the type of graph.
5
Multiple Choice

Name the type of graph.
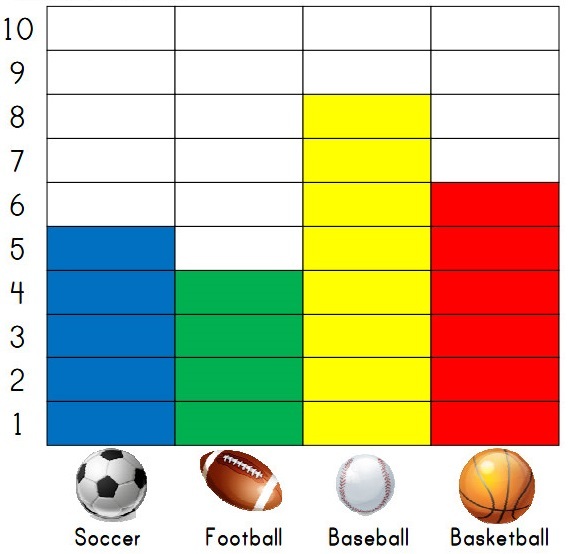
6
Multiple Choice

Name the type of graph.
7
Multiple Choice

Name the type of graph.
8

9

10

11

12

13

14

15

16

17

18
19
Multiple Choice

What is the scale on this chart?
20
Multiple Choice
Look at the Bar Graph "Student Grades". Which grade did the smallest number of students get?
21
Multiple Choice
22
Multiple Choice

23
Multiple Choice
24
Multiple Choice

Mary is recording her plant's growth in a journal. How many inches has the plant grown from week 1 to 7?
25
Multiple Choice
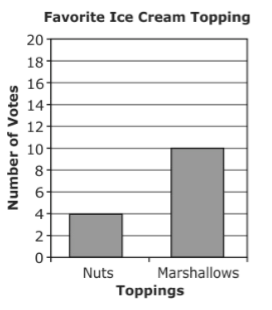
Students voted for their favorite ice cream topping. How many more students chose marshmallows than chose nuts?
26
Multiple Choice

27
Multiple Choice
What is the scale on this Bar Graph?
28
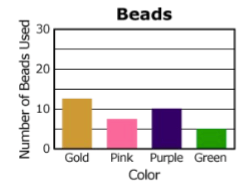
Multiple Choice
The graph shows the number of colored beads used to make a necklace. How many purple and green beads were used in all?
Show answer
Auto Play
Slide 1 / 28
SLIDE
