Search Header Logo
  1. Resource Library
  2. Math
  3. Data And Graphing
  4. ...
  5. Making Bar Graphs
Making Bar Graphs

Making Bar Graphs

Assessment

Presentation

Mathematics

3rd Grade

Medium

CCSS
1.MD.C.4, 2.MD.D.10, 2.MD.D.9

Standards-aligned

Created by

Amber Byrd

Used 64+ times

FREE Resource

14 Slides • 4 Questions

1

Making Bar Graphs

By Amber Byrd

I can use data to make bar graphs.

 I can read a frequency table. 

I can choose a scale for a bar graph. 

I can use a frequency table to make a bar graph.

2

Multiple Choice

Question image
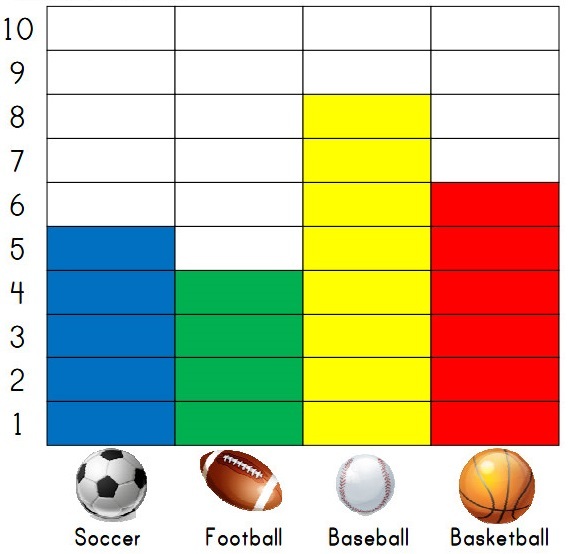
What type of graph is this?
1
bar graph
2
pictograph
3
tally chart

3

Multiple Choice

Question image
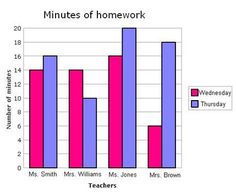
Which day had more minutes of homework?
1
Wednesday
2
Thursday
3
Friday
4
Ms. Jones

4

Multiple Choice

Question image
How many votes did reading receive?
1
2
2
4
3
6
4
8

5

Multiple Choice

Question image
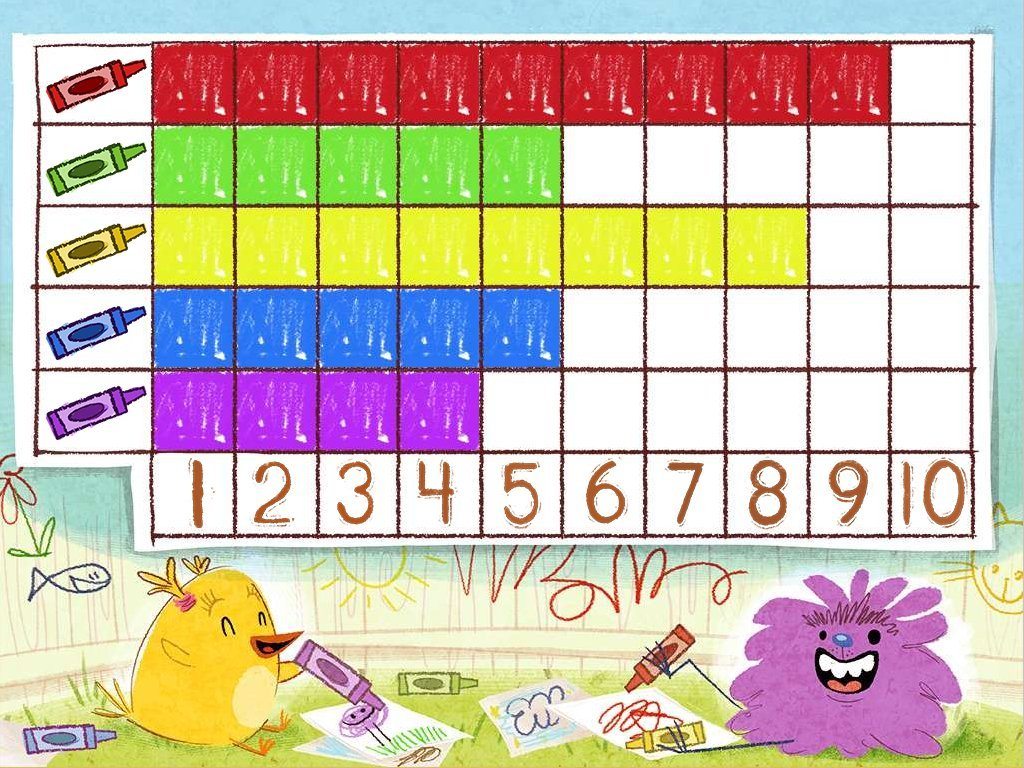
How many more people like red than purple?
1
100
2
10
3
2
4
5

6

media

7

media

8

media

9

media

10

media

11

media

12

media

13

media

14

media

15

media

16

media

17

media

18

media

Making Bar Graphs

By Amber Byrd

I can use data to make bar graphs.

 I can read a frequency table. 

I can choose a scale for a bar graph. 

I can use a frequency table to make a bar graph.

Show answer

Auto Play

Slide 1 / 18

SLIDE