Search Header Logo
Scatter plots y intercepts, slopes, and patterns

Scatter plots y intercepts, slopes, and patterns

Assessment

Presentation

Mathematics

7th - 8th Grade

Medium

CCSS
HSS.ID.B.5, 8.EE.B.5, HSF-LE.A.1B

+5

Standards-aligned

Created by

Teresa Duppstadt

Used 42+ times

FREE Resource

4 Slides • 19 Questions

1

Scatter plots

y intercepts, slopes, and patterns

By Teresa Duppstadt

2

media
media

​Find the slope of the trend line the same way as you do for a line

Diff in y's/Diff in X's ​

Rise/Run​

​3.5 - 1.5/13-6 = 2/7

​​Slope of Trend Line

​The y intercept is where the Trend Line crosses the y axis.

Same as you did when finding the y intercept of a line.​

Y intercept = 27​

​​Y intercept of Trend Line

3

media

4

Correlations

Some text here about the topic of discussion

​Negative Correlations - y decreases while x increases

Positive Correlations - x and y increase

No Correlations - x and y are not related

5

Multiple Choice

What is a scatter plot?
1
A graph that shows the relationship of two data sets.
2
A graph drawn using rectangular bars to show how large each value is.
3
A graph that shows information that is connected in some way.
4
A graph that shows data changing over time.

6

Multiple Choice

What is a line of best fit (Trend Line) used for?

1
To make predictions
2
To make the graph look pretty
3
To connect the points

7

Multiple Choice

Which of the following are ways to find the rate of change?

1

change in y over change in x

2

rise over run

3

subtract y coordinates over subtract x coordinates

4

all these methods will work

8

Multiple Choice

Question image
the slope is -5/7, what does that mean?
1
gain 5 hour of sleep for 7 cups of coffee
2
lose 5 hours of sleep for 7 cups of coffee
3
lose 7 cups of coffee for 5 hours of sleep
4
lose 5 cups of coffee for 7 hours of sleep

9

Multiple Choice

Question image
Find the slope of the line.
1
-5/4
2
5/4
3
-4/5
4
4/5

10

Multiple Choice

Question image
Estimate the y-intercept of the trend line by looking at the graph.
1
2
2
1.8
3
1.2
4
0

11

Multiple Choice

Question image
As the age of the car increases, its value decreases. Which scatter plot represents this relationship?
1
A
2
B
3
C
4
D

12

Multiple Choice

The number of siblings you have and your weight would have which type of correlation? 
1
Positive
2
Negative
3
None
4
All of the above

13

Multiple Choice

What type of correlation (association)?
The outside temperature and the amount of layers you wear. 
1
Positive correlation
2
Negative correlation
3
No correlation
4
All of the above

14

Multiple Choice

Question image

What is the type of association?

1

Negative

2

no association

3

positive

15

Multiple Choice

Question image

What type of association does this graph have?

1

positive

2

negative

3

none

4

all of the above

16

Multiple Choice

Question image

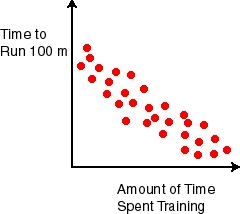
What type of association does this scatter plot show?

1

positive linear association

2

negative linear association

3

no association

4

nonlinear association

17

Multiple Choice

Question image

Choose the graph with a trend line that best fits the data.

1

graph 1

2

graph 2

3

graph 3

4

graph 4

18

Multiple Choice

Question image

Which of the following lines represents the trend line for the scatter plot?

1

A

2

B

3

C

4

D

19

Multiple Choice

Question image
Which best describes the form of this scatterplot?
1
linear
2
nonlinear
3
scattered

20

Multiple Choice

Question image
The red line represents the line of best fit for the scatter plot. How many ice cream sales are expected if the temperature is 90°?
1
55
2
0
3
103
4
100

21

Multiple Choice

You are analyzing a scatter plot that has a negative correlation. What is true of the of the x and y values?
1
As x increases, y decreases
2
As x increases, y increases
3
As x decreases, y decreases

22

Multiple Choice

The height of students and their scores on a test.
1
positive correlation
2
negative correlation
3
no correlation

23

Multiple Choice

The number of notebooks bought and the total cost.
1
positive association
2
negative association
3
no association

Scatter plots

y intercepts, slopes, and patterns

By Teresa Duppstadt

Show answer

Auto Play

Slide 1 / 23

SLIDE