
A Review of Histograms
Presentation
•
Mathematics
•
9th - 10th Grade
•
Easy
•
CCSS
6.SP.B.4, HSS.ID.A.1
Standards-aligned

Abbie Gutzmer
Used 57+ times
FREE Resource
7 Slides • 11 Questions
1

2

3
4
Multiple Choice

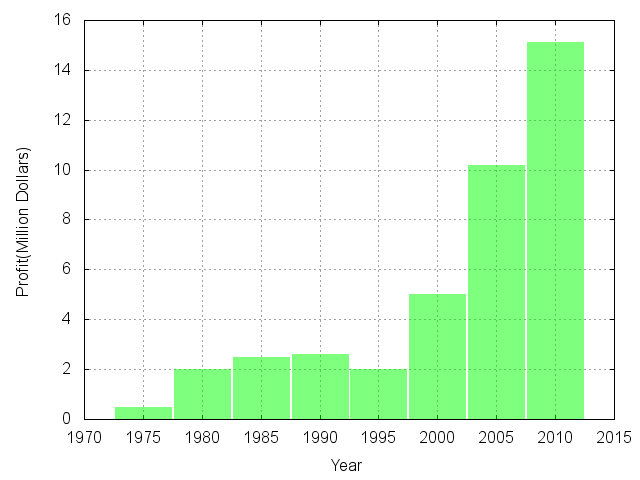
Bar Chart or Histogram?
5
Multiple Select

Bar Chart or Histogram?
6
Multiple Choice

Bar Chart or Histogram?
7
Multiple Choice
Bar Chart or Histogram?
8

9
Multiple Choice

How many different age groups were surveyed about their favorite M & M?
10
Multiple Choice

How many students scored between a 86 and a 90?
11
Multiple Choice

How many people watched between 6 and 10 hours of TV last week?
12

13

14
Multiple Choice

Describe the histogram:
15
Multiple Choice
What is the shape of this bar graph?
16
Multiple Choice

How would you describe this data set?
17
Multiple Choice

The following dot plot is
18
Show answer
Auto Play
Slide 1 / 18
SLIDE
