Search Header Logo
Summer School BIO STAAR review: Environmental Systems

Summer School BIO STAAR review: Environmental Systems

Assessment

Presentation

•

Biology

•

9th - 10th Grade

•

Medium

•
NGSS
MS-LS2-3, MS-LS2-4, MS-LS2-2

+12

Standards-aligned

Created by

Samantha Knowles

Used 8+ times

FREE Resource

25 Slides • 41 Questions

1

Summer School BIO STAAR review: Environmental Systems

By Samantha Knowles

2

Biology EOC Reporting Category 5 Review

Interdependence in Environmental Systems

media

3

Energy Flow in Ecosystems

  • B.12(C) analyze the flow of matter and energy through trophic levels using various models, including food chains, food webs, and ecological pyramids

4

Flow of Energy:

Food Webs & Food Chains

- Food Chain = ONE pathway of the flow of energy

- Food Web = MANY interconnected food chains

5

Trophic Levels

  • Producers/Autotrophs - bottom of the food chain

  • Primary Consumers - get their energy from producers

  • Secondary Consumers - get their energy from primary consumers

  • Tertiary Consumers - get their energy from secondary consumers

media

6

Trophic Levels (cont.)

  • Some organisms can fall under more than one trophic level based on what their energy sources are

  • In this food web, the bird is both a primary consumer and a secondary consumer based on it's energy sources

media

7

Pyramid of Energy

  • Shows the flow of energy through trophic levels

  • 10% Rule - the subsequent trophic level will consume 10% of the energy available from it's meal

  • Producers contain 100% of the available energy whereas the top only has 0.1%

  • 90% of energy is lost as HEAT

media

8

Pyramid of Biomass

  • Shows the amount of Biomass/Dry weight (aka FOOD) available at each trophic level

  • Aquatic and Terrestrial biomass pyramids are generally different, where aquatic ecosystems are flipped

  • Width of bars for each level corresponds to amount of biomass

media

9

Multiple Choice

Which is a producer?
1
deer
2
tall grass
3
lion
4
worm

10

Multiple Choice

Question image
An organism that lives by breaking apart dead organic matter into simpler parts is...
1
scavenger
2
consumer
3
decomposer
4
carnivore

11

Multiple Choice

Question image

Which of the following are missing from the food web shown?

1

Producers

2

Decomposers

3

Omnivores

4

Predators

12

Multiple Choice

Question image

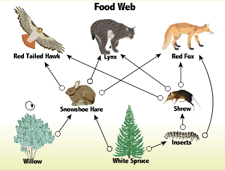
A partial meadow food web is shown to the left.


Based on this food web, which organisms are direct sources of energy for secondary consumers?

1

Aphid, Bird, Rabbit

2

Ladybug, Fox, Dragonfly

3

Frog, Butterfly, Berries

4

Mouse, Snake, Hawk

13

Multiple Choice

Question image

Part of a hydrothermal vent food web is shown in the diagram.


Which organisms are both secondary and tertiary consumers in this food web?

1

Chemosynthetic bacteria and amphipods

2

Zooplankton and mussels

3

Ratfish and octopuses

4

Galatheid crabs and zoarcid fish

14

Multiple Choice

Question image

A terrestrial food web is shown in the image.


Which of the following only lists organisms that are secondary consumers in this food web?

1

Mice, Rabbits, Herbivorous Insects, and Squirrels

2

Spiders, Foxes, Owls, Hawks, and Snakes

3

Predaceous Insects, Toads, Spiders, and Foxes

4

Insectivorous Birds, Seed-eating Birds, Owls, and Hawks

15

Multiple Choice

Question image

The energy pyramid shows the energy made by producers.


Based on the energy flow between trophic levels in an energy pyramid, how much energy would be expected to be found at the secondary consumer level in this pyramid?

1

100 joules

2

500 joules

3

1,000 joules

4

50 joules

16

Multiple Choice

Question image

A marine ecosystem is shown in the image.


What is lost to the environment at each of the trophic levels in the ecosystem?

1

Nutrients from the soil

2

Living space for the organisms

3

Food sources

4

Heat

17

Multiple Choice

Question image

A pyramid of biomass is shown of an ecosystem.


Which statement provides the best explanation for the difference in biomass of organisms found at each trophic level?

1

Organisms at higher trophic levels have less energy available to them than the organisms at lower trophic levels

2

Organisms at higher trophic levels require smaller habitats than organisms at lower trophic levels

3

Organisms at lower trophic levels provide less energy than organisms at higher trophic levels

4

Organisms at lower trophic levels outcompete organisms at higher trophic levels

18

Multiple Choice

Question image

The diagram shows a partial food web containing the Glyptapanteles wasp and it's life cycle.


Based on the the diagrams, which list correctly identifies the relationships the Glyptapanteles wasp larvae have with other organisms?

1
2
3
4

19

Multiple Choice

Question image

Four common relationships are shown in the chart.


Which statement best describes these relationships?

1
2
3
4

20

Organism Behavior

  • B.12(A) interpret relationships including predation, parasitism, commensalism, mutualism, and competition among organisms

21

Feeding Relationships

  • Predation - one organism consumes another for energy

  • Competition - two or more organisms competing for the same resource/energy source

media

22

Symbiotic Relationships

  • Symbiosis - a close relationship between two species where at least one organism benefits

23

media

24

Mutualism (+/+)

BOTH organisms benefit from the relationship

media

25

Commensalism (+/0)

One organism benefits while the other is unaffected

media

26

Parasitism (+/-)

  • One organism benefits from the relationship while the other is harmed

  • Host - the organism that is harmed

  • Parasite - the organism that benefits from the host

media

27

Matter Flow in Ecosystems

  • B.12(D) describe the flow of matter

    through the carbon and nitrogen cycles and explain the consequences of disrupting these cycles

28

Carbon Cycle

  • The recycling of carbon in the ecosystem

  • Carbon sinks have the ability to hold large amounts of carbon (i.e. oceans, forests, and fossil fuels)

  • ALL living things contain carbon

media

29

Nitrogen Cycle

  • The recycling of Nitrogen in the ecosystem

  • Nitrogen fixation is the process in which bacteria convert atmospheric nitrogen into usable sources for plants

  • Animals obtain their nitrogen from other organisms, primarily plants, from proteins

media

30

Multiple Choice

What is the only process that removes carbon from the atmosphere?
1
combustion
2
cellular respiration
3
photosynthesis
4
decomposition

31

Multiple Choice

Where is carbon stored in the environment?
1
Fossil fuels
2
Wood of trees
3
Calcium carbonate (shells and bones)
4
All of the above

32

Multiple Choice

Question image
An oreo cookie weighs 20 grams.  It gets crushed into crumbs for a recipe.  How much do its crumbs weigh?
1
15 grams
2
25 grams
3
20 grams

33

Multiple Choice

Which one of these does not add CO2 to the atmosphere?

1
cooking with gas
2
planting trees
3
burning wood
4
riding in a bus

34

Multiple Choice

Question image

The diagram shows why the ocean is a large carbon sink.


An increase in the amount of carbon dioxide in the atmosphere can cause atmospheric temperatures to increase. Which statement best explains how this could affect the ocean as a carbon sink?

1

Less atmospheric carbon dioxide would be available to phytoplankton

2

Dissolved carbon dioxide gas in the ocean would increase because surface winds would cause a deeper circulation pattern, making more room for the gas

3

Less carbon dioxide gas would be contained in the ocean because increasing precipitation would dilute the carbon entering the ocean

4

Less carbon dioxide would be dissolved in the ocean because increasing atmospheric temperatures would cause the ocean temperature to increase

35

Multiple Choice

As a part of the nitrogen cycle, animals acquire some amino acids by doing which of the following?

1

Breathing air

2

Eating plants

3

Drinking water

4

Producing waste

36

Multiple Choice

Question image

The carbon cycle includes processes that release carbon dioxide into the atmosphere and places that act as carbon reservoirs. The diagram in the image shows both major processes that release carbon and major carbon reservoirs.


Which of these disruptions would cause an excess output in the carbon cycle?

1

The destruction of terrestrial biota

2

Increases in marine biota

3

A reduction in the use of fossil fuels

4

A thickening of ocean sediments

37

Multiple Choice

Question image

The diagram in the image represents the nitrogen cycle in a student's aquarium. Ammonia, nitrites, and, to a lesser degree, nitrates can be harmful to fish. The student wants to keep the nitrogen in this aquarium cycling normally without having to continually change the water.


Which of the following should the student add more of to help remove the nitrates and improve the natural cycling of nitrogen in this aquarium?

1

Fish

2

Plants

3

Nitrobacter

4

Water

38

Ecological Succession

  • B.11(B) describe how events and processes that occur during ecological succession can change populations and species diversity

  • B.11(A) summarize the role of microorganisms in both maintaining and disrupting the health of both organisms and ecosystems

39

Ecological Succession

  • Succession - changes in the environment over time

  • Pioneer Species - first species to appear in an area

  • Climax Community - the resulting ecosystem following ecological succession where diversity is high and the ecosystem is relatively stable

40

Primary Succession

  • Longer period of time to reach climax community

  • Start with bare rock/nothing

  • Pioneer species = lichen and mosses, which break down rock into soil, provide nutrients to the soil, and give way to larger more complex plant life

media

41

Secondary Succession

  • Shorter process of succession to reach a climax community

  • Pioneer species = small plants and grasses

  • Generally follows after an environmental catastrophe such as a forest fire, flooding, or human destruction

media

42

Ecosystem Stability

  • B.12(E) describe how environmental change can impact ecosystem stability

43

Carrying Capacity

  • The total population of organisms that can be supported by an ecosystem

  • Limiting factors - resources in the ecosystem (biotic & abiotic) that can limit the population of individuals (ex. Water, Space, Mates, Food)

  • The environment will naturally stabilize the population

media

44

Human Impacts

  • Pollution/runoff can add excess carbon and toxins into the ecosystem

  • Overhunting/overfishing will reduce the population of animals which reduces the amount of food for organisms that rely on them

  • Deforestation destroys the habitats of many organisms forcing them to move elsewhere

media

45

Multiple Choice

Question image
What is the order of succession shown in this figure?
1
A, B, C, D
2
B, A, D, C
3
C, D, A, B
4
D, A, B, C

46

Multiple Choice

Question image

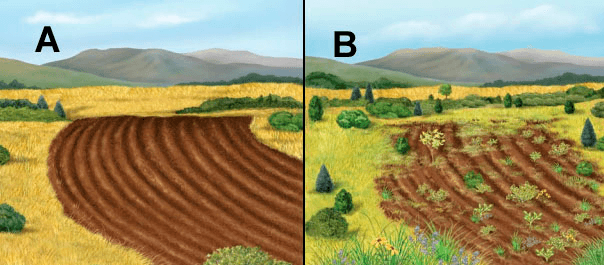
What type of succession is shown going from figure A to figure B?rt54

1
primary succession
2
ecological succession
3
secondary succession
4
intermediate

47

Multiple Choice

Succession that occurs in an area with NO SOIL
1
ecological succession 
2
primary succession 
3
secondary succession
4
pioneer speciles

48

Multiple Choice

Question image
What is the correct order from oldest (happened first) to youngest (happened last) in this pond succession?
1
A, B, C, D
2
D, C, B, A
3
B, A, D, C
4
C, D, A, B

49

Multiple Choice

Question image

Enchanted Rock State Natural Area is located in central Texas. Enchanted Rock is a dome of granite. The area consists of four easily identifiable communities. The table describes the characteristics of each type of community in the area.


A student studying primary succession should focus on which of these communities?

1

Open oak woodland

2

Mesquite grassland

3

Floodplain

4

Granite rock

50

Multiple Choice

Question image

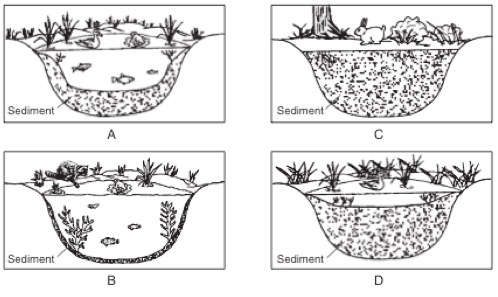
The graph shows the basic changes in a forest community following a disturbance.


The information shown in the graph suggests that the changes in the forest community were caused by-

1

tree-leaf replacement after a storm

2

succession after a fire

3

repeated habitat destruction

4

decreased species diversity

51

Multiple Choice

Question image
What is the carrying capacity of the following graph?
1
1000
2
8000
3
800
4
600

52

Multiple Choice

Question image
Which of the following would be the most likely effect, if there were a sudden increase in the cricket population?
1
There would be a decrease in the small bird population.
2
There would be a decrease in the grass/flowers population.
3
There would be a decrease in the mice population.
4
There would be an increase in the grass/flowers population.

53

Multiple Choice

Examples of how humans negatively affect local ecosystems are
1
Building dams, deforestation (cutting down trees), adding point sources to nearby streams to allow for run-off, building roads and structures, and salting roads.
2
Creating laws to prohibit fishing from local streams.
3
Planting trees and other plants to attract native species.
4
Removing non-native species from the environment.

54

Multiple Choice

Question image
What may happen if the snowshoe hare was removed from the food web pictured?
1
The insects in the habitat would increase.
2
The shrew population would decrease due to being only hawk food source.
3
The willow tree population would decrease.
4
Foxes would dies due to no food source. 

55

Multiple Choice

During secondary succession, which of these best describes why decomposing pioneer plants give way to larger, more complex plant species, such as hardwood trees?

1

Increased amounts of sunlight are able to reach the ground while the pioneer species are decomposing

2

Increased soil temperatures from decomposing pioneer species help tree seeds germinate more quickly

3

Increased amounts of decomposing pioneer species remove nutrients that tree seedlings need to grow and mature

4

Increased amounts of soil from decomposing pioneer species allow plants with more extensive root systems to become established

56

Multiple Choice

Roads are often built through forests for industrial purposes or as land developed for residential or commercial needs. How would road construction through a forest most likely affect the ecosystem?

1

Non-native species would replace native species

2

The number of primary consumers would increase

3

The natural succession of vegetation would change

4

All producers will be eliminated from the community

57

Multiple Choice

Dead zones are low-oxygen areas that develop on the sea floor. Scientists hypothesize that phytoplankton blooms cause the dead zones. Phytoplankton blooms occur when excess nutrients are introduced by pollution from fertilizers, sewage plants, and the burning of fossil fuels. Which of the following would most likely cause an increase in these contributors to dead zones?

1

Rainfall patterns that increase freshwater runoff from terrestrial areas

2

Replacing coal-fired power plants with windmills

3

Farming practices that reduce nitrate and phosphate applications

4

Constructing efficient water-recovery and treatment plants

58

Poll

Question image

A

B

C

D

59

Poll

Question image

A

B

C

D

60

Poll

Question image

A

B

C

D

61

Poll

Question image

A

B

C

D

62

Poll

Question image

A

B

C

D

63

Poll

Question image

What is the correct classification of this symbiotic relationship?

Predator/prey

Mutualism

Commensalism

Parasite/host

64

Poll

Question image

A

B

C

D

65

Poll

Question image

A

B

C

D

66

Poll

Question image

Which component can be added to the flask to reduce the concentration of carbon dioxide in the atmosphere created by the disks?

Bacteria to use carbon during nitrification

Plants to absorb carbon during photosynthesis

Snails to use carbon through cellular respiration.

Mushrooms to use carbon through the process of decomposition.

Summer School BIO STAAR review: Environmental Systems

By Samantha Knowles

Show answer

Auto Play

Slide 1 / 66

SLIDE