
Interpreting Motion Graphs
Presentation
•
Physics
•
9th - 12th Grade
•
Medium
Standards-aligned

Robert Johnson
Used 263+ times
FREE Resource
0 Slides • 18 Questions
1
Multiple Choice
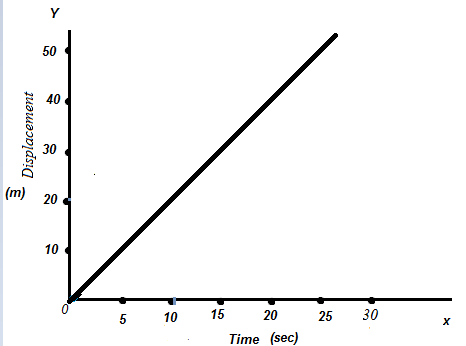
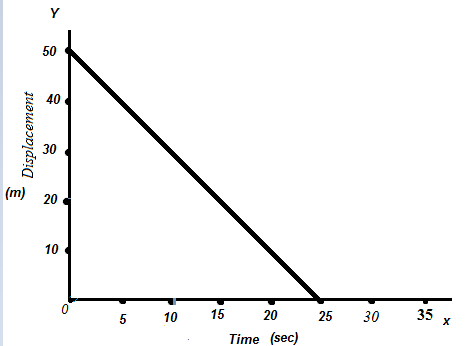
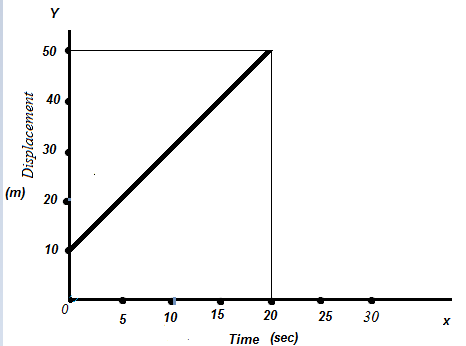
What is shown in this displacement vs time graph?
2
Multiple Choice
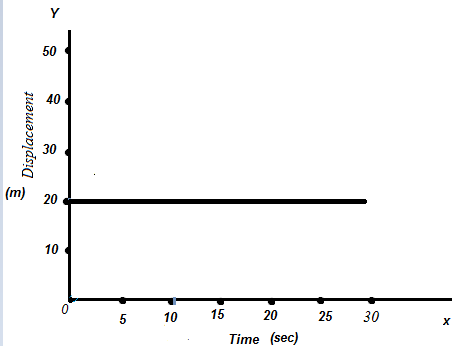
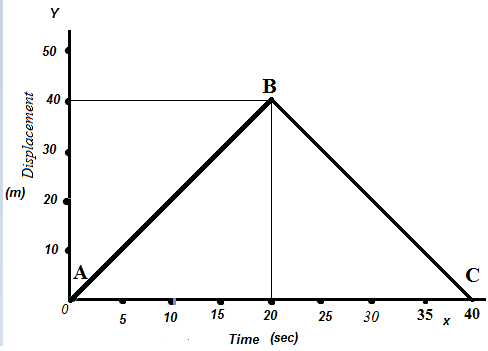
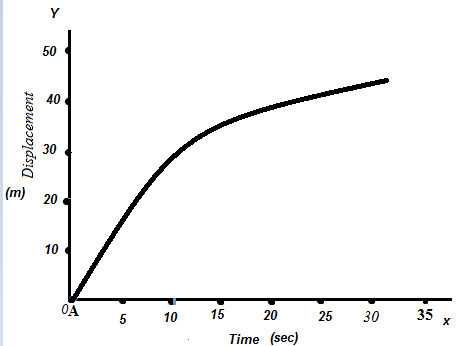
What does this graph mean?
3
Multiple Choice
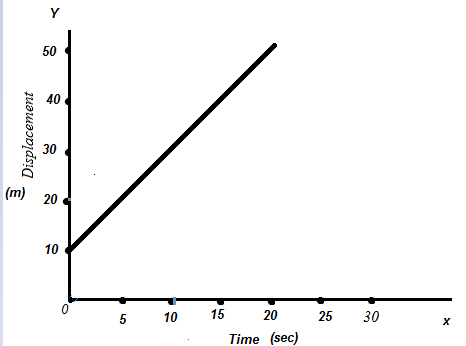
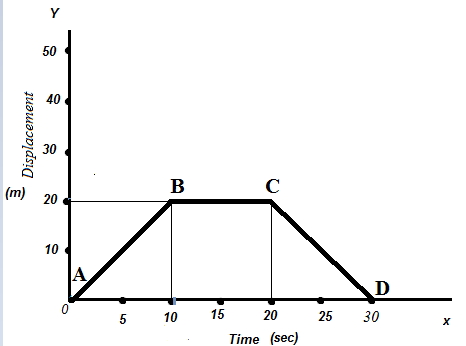
What is shown in this graph?
4
Multiple Choice
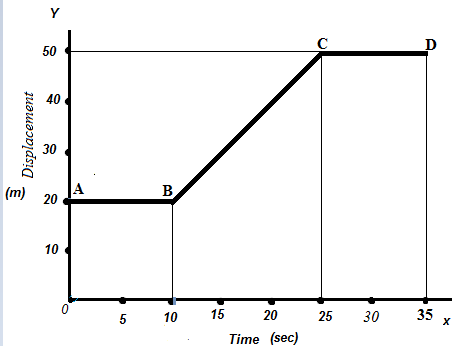
What is happening between B and C in this graph?
5
Multiple Choice
What is happening between C and D in this graph?
6
Multiple Choice
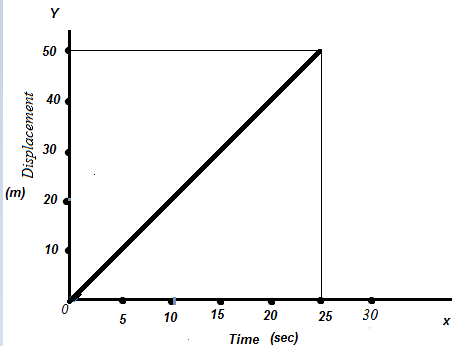
What is happening in this graph?
7
Multiple Choice
What is happening from A to B?
8
Multiple Choice
What is happening from B to C?
9
Multiple Choice
What is happening from A to B, from B to C and from C to D in the given graph?
10
Multiple Choice
Find the velocity from the given graph.
11
Multiple Choice
Find the velocity from the given graph.
12
Multiple Choice

Find the velocity from the given graph.
13
Multiple Choice

what does this graph show?
14
Multiple Choice
what is shown in this graph?
15
Multiple Choice

Calculate the displacement traveled in section C. Hint: Remember the area under a v-t graph = displacement and you will need to use TWO shapes!
16
Multiple Choice

Use the graph above and pick the most accurate description of the object's motion
17
Multiple Choice

Use the picture above to choose the most accurate description of the object's motion
18
Multiple Choice

Use the picture to choose the most accurate description of the object's motion
What is shown in this displacement vs time graph?
Show answer
Auto Play
Slide 1 / 18
MULTIPLE CHOICE
