
9-1 Scatter Plots
Presentation
•
Mathematics
•
8th - 11th Grade
•
Easy
•
CCSS
HSS.ID.B.5, 8.SP.A.1, HSF.IF.B.4
+2
Standards-aligned

Karina Taveras
Used 91+ times
FREE Resource
5 Slides • 10 Questions
1
2

3
Multiple Choice
4

5
Multiple Choice

What type of association does this graph have?
6
Multiple Choice

What type of association does this graph have?
7
Multiple Choice

What type of association does this scatter plot show?
8
Multiple Choice

Based on the scatterplot, which of the following conclusions about the relationship between her height and weight is true?
9

10
Multiple Choice
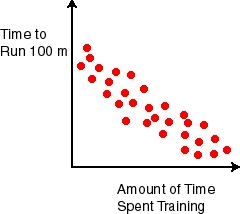
What type of association does this scatter plot show?
11
Multiple Choice

Which scatter plot shows a linear relationship between x and y?
12

13
Multiple Choice
14
Multiple Choice

Identify any outliers.
15
Multiple Choice

Identify any clusters.
Show answer
Auto Play
Slide 1 / 15
SLIDE
