
8th Grade Winter Break Tutorials Trend Lines, Slope and Graphing
Presentation
•
•
Medium

Jessica Page
Used 6+ times
FREE Resource
53 Slides • 92 Questions
1

2
3

4

5

6

7
Multiple Choice

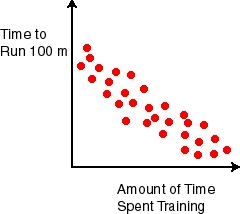
What is the type of correlation for this scatter plot?
8
Multiple Choice

What is the type of correlation for this scatter plot?
9

10
Multiple Choice

Which sentence describes the relationship shown on this scatter plot?
11
Multiple Choice
12
Multiple Choice

A teacher made the following graph showing the number of hours that a student studied for an exam versus their exam grade. Predict the grade of a student if they studied for 3.5 hours.
13

14

15
Multiple Choice

Which trend line matched the scatter plot best?
16
Multiple Choice

Which trend line matched the scatter plot best?
17
Multiple Choice

Which trend line matched the scatter plot best?
18

19
Multiple Choice

The scatter plot shows the relationship between the number of chapters and the total number of pages for several books. Use the trend line to predict how many chapters would be in a book with 140 pages.
20
Multiple Choice

The graph shows a line of best fit for data collected on the amount of income earned by lawn companies in relation to the number of yards mowed. What is the equation of the trend line?
Look at the scale on each axis.
21
Multiple Choice
22
Multiple Choice
23
Multiple Choice

24
Multiple Choice

25
Multiple Choice
26
Multiple Choice

Which scatter plot shows a linear relationship between x and y?
27
Multiple Choice

28
Multiple Choice

29
Multiple Choice
30
Multiple Choice
What type of association does this scatter plot show?
31
Multiple Choice

32

33

34
Multiple Choice
35
36

37

38

39

40

41
Multiple Choice

Which graph shows a line of best fit (trend line) for the scatter plot?
42
Multiple Choice

43
Multiple Choice

44
Multiple Choice

45
46
Multiple Choice

47
Multiple Choice

Based on this scatterplot, approximately what score would a student with 6 absences expect to receive on the final exam?
48
Multiple Choice

49
Multiple Choice
50
Multiple Choice

51
Multiple Choice
52
Multiple Choice

53
Multiple Choice
54
Multiple Choice

Which line appears to fit the data better?
55
Multiple Choice
56
Multiple Choice
57
Multiple Choice
58
Multiple Choice
59
Multiple Choice

60
Multiple Choice
61
Multiple Choice

62
Multiple Choice
63
Multiple Choice

The scatterplot shows the temp, in degrees, outside a house every hour for 10 hours.
Estimate the temp after 13 hours based off the trendline.
64
Multiple Choice

The slope of the trend line is
What does that mean?
65
Multiple Choice

Which of the following could be the equation of the trend line for this graph?
66
Multiple Choice

Which equation could be a trend line for this graph?
67
Multiple Choice

Which of the following would be the most accurate equation for the scatter plot?
68
Multiple Choice

What is the slope of this trend line?
69
Multiple Choice

70
Multiple Choice

71
Multiple Choice

72
Multiple Choice
What the y-intercept for the line of best fit for the scatter plot?
73
Multiple Choice

74
Multiple Choice

What kind of association does the scatter plot show?
75
Multiple Choice

What kind of association does the scatter plot show?
76
Multiple Choice

Mrs. Collins made a scatterplot to show the relationship between the number of absences and a student’s final exam score. Based on this scatterplot, a student with 6 absences should get approximately what score on the final exam?
77
Multiple Choice

78
Multiple Choice
79
80

81

82
Multiple Choice
83
Multiple Choice
84
Multiple Choice
85
Multiple Choice
86
87

88

89
Multiple Choice
90
Multiple Choice
91
92

93
Multiple Choice
94
Multiple Choice
95

96
97

98

99

100

101
102
103
104
105
106
107
108
109
110
Multiple Choice
111

112
Multiple Choice
113

114
Multiple Choice

What is the solution?
115
116
Multiple Choice

What is the solution?
117
Multiple Choice

118
119
120

121
Multiple Choice

Identify the slope as positive, negative, zero or undefined.
122
Multiple Choice
123
Multiple Choice
124

125
Multiple Choice
126
Multiple Choice
127
Multiple Choice
128
Multiple Choice

129

130
Multiple Choice

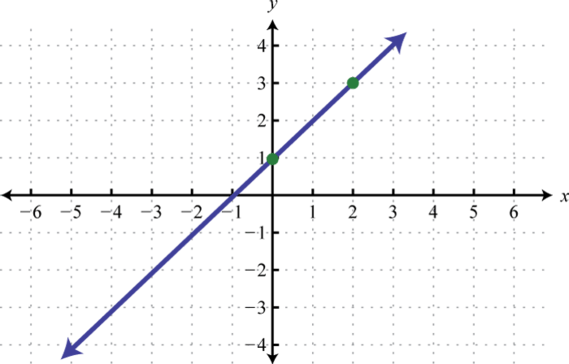
Write the equation for the line in slope-intercept form.
131
Multiple Choice

Which equation matches the graph? (Click me to see the image)
132
Multiple Choice

Write the equation of the line.
133

134
Multiple Choice
135
Multiple Choice
136
Multiple Choice
137

138
Multiple Choice
139
Multiple Choice
140
Multiple Choice
141

142
Multiple Choice
143
Multiple Choice

Linear or Nonlinear?
144
Multiple Choice

Linear or Nonlinear?
145
Multiple Choice

Linear or Nonlinear?
Show answer
Auto Play
Slide 1 / 145
SLIDE
