
Graphing Linear Equations
Presentation
•
Mathematics
•
8th Grade
•
Practice Problem
•
Medium
•
CCSS
HSF.IF.A.2, 8.F.A.3, 8.F.B.4
+1
Standards-aligned

Kristan Rushe
Used 93+ times
FREE Resource
11 Slides • 13 Questions
1
2

3

4
Multiple Choice

What is the x-intercept of the graph?
5
Multiple Choice

What is the y-intercept?
6
Multiple Choice

What is the x-intercept?
7
Multiple Choice

What is the y-intercept?
8

9

10
Fill in the Blanks
11
Fill in the Blanks
12
Fill in the Blanks
13
Fill in the Blanks
14
Multiple Choice
15

16

17

18

19
Multiple Choice

Which is the graph of y= -x + 2?
20
Multiple Choice

Graph. x = 1
21
Multiple Choice
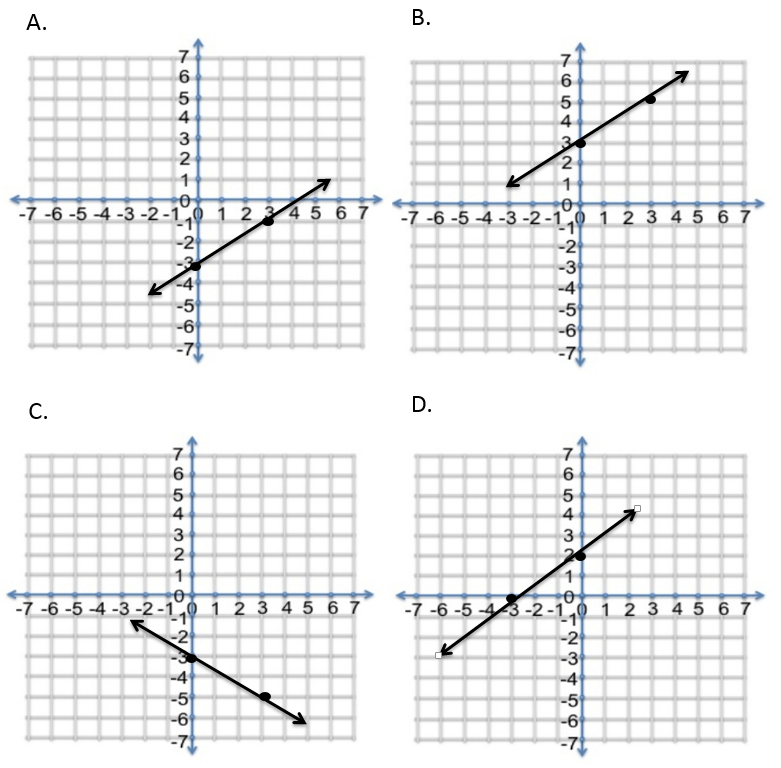
Graph. y = 2/3x - 3
22
Multiple Choice

Which equation represents the following graph?
23

24

Show answer
Auto Play
Slide 1 / 24
SLIDE
