Search Header Logo
  1. Resource Library
  2. Math
  3. Percents, Ratios, And Rates
  4. Percent Proportion
  5. 8.4 Percent Proportions And Circle Graphs
8.4 Percent Proportions and Circle Graphs

8.4 Percent Proportions and Circle Graphs

Assessment

Presentation

Mathematics

8th Grade

Medium

CCSS
6.RP.A.3C, 7.RP.A.2C

Standards-aligned

Created by

Rabah Issa

Used 7+ times

FREE Resource

10 Slides • 34 Questions

1

Learning Target

I will review on how to solve percent proportions.

2

How do I make my percent proportion?

  • Identify if the given quantity is a PART or a WHOLE amount

  • % is always out of 100, so this means " % / 100% "

media

3

Solving Percent Proportions (Part 2)

Percent - a ratio out of 100

Proportion - equation stating two ratios are equal

Part - portion of a quantity

Whole - entire amount

media

4

A helpful tip...

Percentages will have this symbol "%" & always have 100% in the denominator


If a quantity is a PART look for the word "is"


If a quantity is a WHOLE look for the word "of"

media

5

How do you solve for a percent?

  • Write out your % Proportion: part/whole = % / 100%

  • Scale up or down as necessary

media

6

​Percent Proportions

​Watch the video if you still need help setting up and solving percent proportions

7

Multiple Choice

Question image

In a neighborhood, there are 9 families that own a poodle. If these owners make up 50% of all dog owners in the neighborhood, how many dog owners are there?


What part of the percent proportion are you missing? (What is this question asking you to find?)

1

Part

2

Whole

3

Percent

8

Multiple Choice

Percents are always out of ...

1

1

2

100

3

thin air

4

this world

9

Multiple Choice

Determine if you are finding the part, percent, or whole:

12 is 50% of what number?

1

Part

2

Percent

3

Whole

10

Multiple Choice

Determine if you are finding the part, percent, or whole:

What is 20% of 60?

1

Part

2

Percent

3

Whole

11

Multiple Choice

Which of these proportional equations would you use to find the missing pieces of a percent problem, using the words "Part and Whole"?

1
2
3
4

12

Multiple Choice

Which of these proportional equations would you use to find the missing pieces of a percent problem, using the words "OF and IS"?

1
2
3
4

13

19 is what % of 70?​

Example 1:

Example 2:

​75% of 600 is what number?

media

14

Multiple Choice

Which of these is set up correctly for "30 is what percent of 600"?

1
2
3
4

15

Multiple Choice

Which of these is set up correctly for "What percent of 55 is 80"?

1
2
3
4

16

Multiple Choice

Which of these is set up correctly for "What is 6% of 90"?

1
2
3
4

17

Multiple Choice

Which of these is set up correctly for "Find 40% of the number 85"?

1
2
3
4

18

Multiple Choice

There are 9 students in a classroom that play football, this is 37.5% of the class. How many students are in the class?

Set up a proportion to help you solve this problem.

1
2
3
4

19

Multiple Choice

Pacino worked 8 hours out of the day. What percent of the day did he work?

1
2
3
4

20

Multiple Choice

: : DANGER : :

Nyla took a math test and got 12 correct and 3 incorrect answers. What was the percent of wrong answers?

1
2
3

21

media
  1. Cross Multiple & Divide

  2. Scaling Up or Down

Solving

22

Multiple Choice

Sally got 22 questions wrong on her quiz that had 40 questions on it. What is the percentage of the questions she got wrong?
1

45%

2

55%

3

32%

4

95%

23

Multiple Choice

What is 9% of 200?
1

100

2

18

3

20

24

Multiple Choice

What percent of 200 is 28?
1

20%

2

30%

3

14%

4

28%

25

Multiple Choice

In a class of 30 kids, 3 forgot to get their report cards signed. What percent is that?
1

3%

2

30%

3

10%

4

70%

26

  • another name for a pie chart

  • a way of displaying data​

  • data divided into parts called sectors​

Some text here about the topic of discussion.

What is a circle graph?

27

Multiple Choice

Question image

Based on this graph, which sector is bigger?

1

romance

2

drama

3

sci-fi

4

action

28

Multiple Choice

Question image

Based on this graph, which type of movie do most people prefer?

1

action

2

romance

3

comedy

4

drama

29

Multiple Select

Question image

Select all that is true about circle graphs

1

Another name for a pie chart

2

A way of displaying data

3

divided into parts called sectors

30

Multiple Choice

Question image

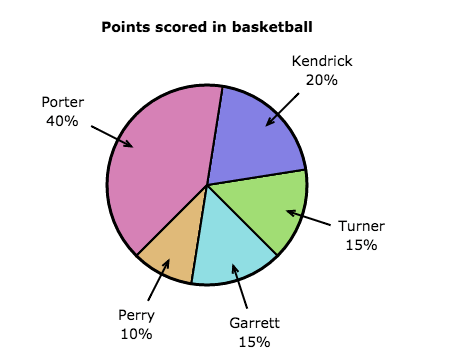
What is the title of the circle graph?

1

Sea cumbers

2

Kinds of echinoderms

3

Sea urchings and sand dollars

4

Seal lillies

31

Multiple Choice

Question image

What is the red sector?

1

Sea cumbers

2

Kinds of echinoderms

3

Sea urchings and sand dollars

4

Sea lillies and feather stars

32

Multiple Choice

Question image

What is the purple sector?

1

Sea cumbers

2

Kinds of echinoderms

3

Sea urchings and sand dollars

4

Sea stars

33

Multiple Choice

Question image

What group of echinoderms include the greatest number of species?

1

Sea cucumbers

2

Sea urchins and sand dollars

3

Brittle stars and basket stars

4

Sea stars

5

Sea lillies and feather stars

34

Multiple Choice

Question image

What group of echinoderms include the greatest number of species?

1

Sea cucumbers

2

Sea urchins and sand dollars

3

Brittle stars and basket stars

4

Sea stars

5

Sea lillies and feather stars

35

Multiple Choice

Question image

HOW MANY of the 30 people said they own dogs only?

1

3

2

15

3

6

4

20

5

30

36

Representing Circle Graphs

  • A circle graph or pie chart displays data as sections of a circle.

  • A full circle represents 100% of the data.

  • The percent (or fractional part) of each section represents a part of the whole data set.

37

Multiple Choice

Question image

Which amount of texts was sent the least?

1

0-49

2

50-99

3

100+

38

Multiple Choice

Question image

Which amount of texts was sent the most?

1

0-49

2

50-99

3

100+

39

Multiple Choice

Question image

Which is the students' least favorite sport?

1

basketball

2

baseball

3

hockey

4

football

40

Multiple Choice

Question image

What percentage does the entire circle graph represent?

1

100%

2

50%

3

25%

4

15%

41

Multiple Choice

Question image
Students were surveyed about their favorite sports to play in phys.ed. The results are represented in this circle graph. If 48 students were surveyed, how many chose soccer?
1

10

2

12

3

15

4

14

42

Multiple Choice

Question image
If there are 300 seventh graders, how many students prefer choir?
1

96

2

24

3

75

4

42

43

Multiple Choice

Question image
There are 200 vegetable plants in a garden.  How many of the vegetable plants are green beans?
1

16

2

24

3

28

4

32

44

Multiple Choice

Question image
The team scored 50 points. How many points did Kendrick score?
1

12 points

2

20 points

3

10 points

4

72 points

Learning Target

I will review on how to solve percent proportions.

Show answer

Auto Play

Slide 1 / 44

SLIDE