
Make and Interpret Circle Graphs
Presentation
•
Mathematics
•
7th Grade
•
Easy
Standards-aligned

Alina Sanchez Mederos
Used 43+ times
FREE Resource
2 Slides • 19 Questions
1
2
3
Multiple Choice
4
Multiple Choice
5
Multiple Choice
6
Multiple Choice
7
Multiple Choice
8
Multiple Choice
9
Multiple Choice
10
Multiple Choice

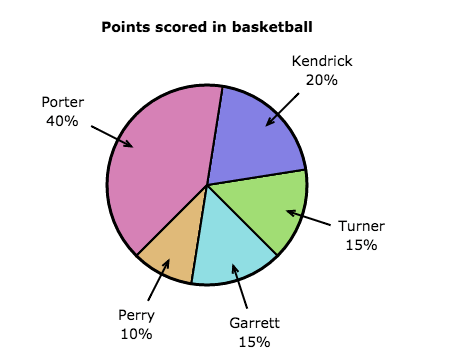
Which table represents the data in the graph?
11
Multiple Choice
Which table represents the data in the graph?
12
Multiple Choice
13
Multiple Choice
14
Multiple Choice

15
Multiple Choice
16
Multiple Choice

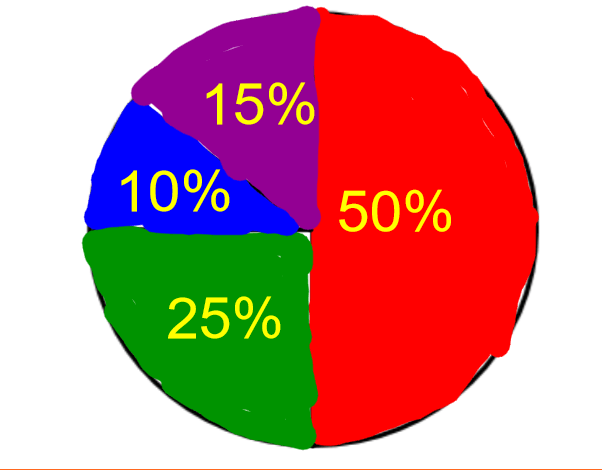
If the total was 120 how many people would be in blue?
17
Multiple Choice
If the total was 120 how many people would be in blue?
18
Multiple Choice

If the total was 200 how many people would be in red?
19
Multiple Choice
If the total was 200 how many people would be in red?
20
Multiple Choice

21
Multiple Choice
Show answer
Auto Play
Slide 1 / 21
SLIDE
