
2/16 REVIEW UNIT 3 LESSONS 1-6
Presentation
•
Mathematics
•
8th Grade
•
Medium
+6
Standards-aligned

Brittany Johnson
Used 1+ times
FREE Resource
6 Slides • 17 Questions
1

2

3
Multiple Choice

How many more children prefer playing cricket than netball?
4
Multiple Choice

The two-way table shows what food and/or drink customers bought from a stall. How many people bought only one item?
5
Multiple Choice

The table shows incomplete info about customers' orders in a cafe. How many women visited the cafe in total?
6

7
Fill in the Blanks

Type answer...
8
Fill in the Blanks
Type answer...
9
Fill in the Blanks
Type answer...
10
Fill in the Blanks

Type answer...
11
Open Ended

Give an example of when scatterplots would be useful outside of the classroom.
12
Multiple Choice
13
Multiple Choice

CLICK the picture for easier reading. What statements are true?
14
Multiple Choice

What does the blue point represent?
15

16
Multiple Choice

Which of the following lines represents the line of best fit for the scatter plot?
17
Multiple Choice

A teacher made the following graph showing absences vs. final grades. Predict the grade of a student that has 7 absences.
18
Multiple Choice

A teacher made the following graph showing the number of hours that a student studied for an exam versus their exam grade.
Predict the grade of a student if they studied for 3.5 hours
19


20
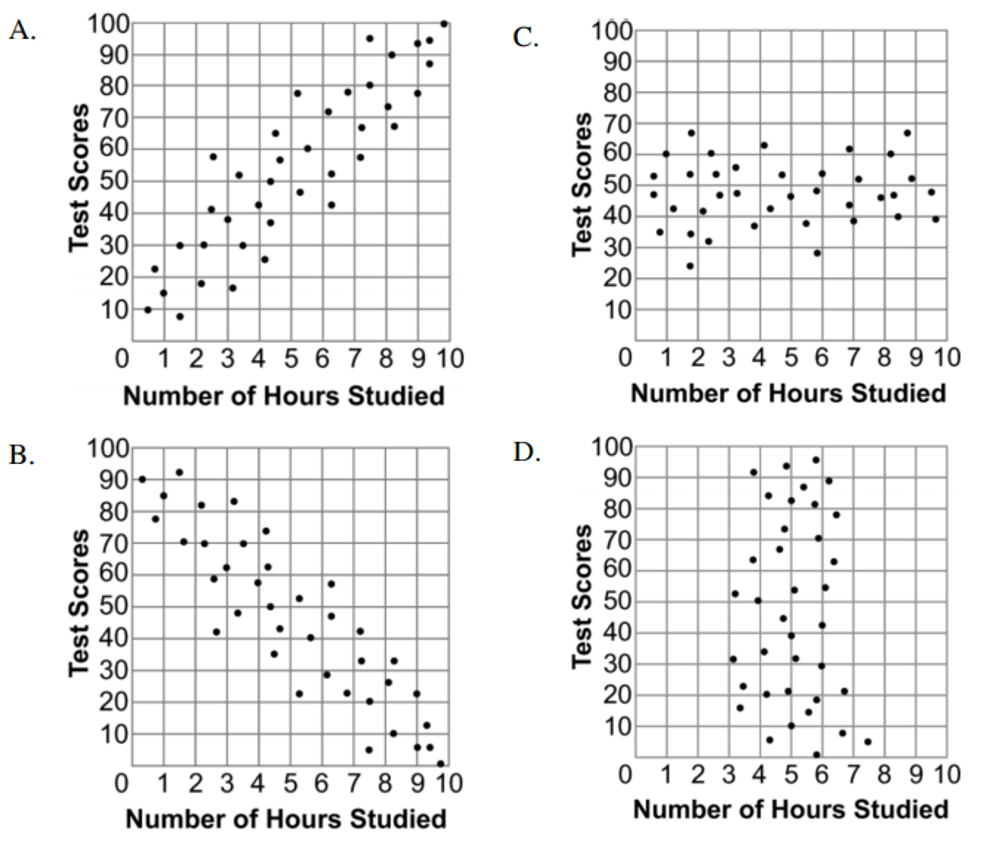
Multiple Choice
21


22
Multiple Choice

23
Multiple Choice

Would the linear model be appropriate?
Show answer
Auto Play
Slide 1 / 23
SLIDE
