
3.2 Motion Graphs
Presentation
•
Science
•
7th Grade
•
Easy
Standards-aligned

William Katumba
Used 9+ times
FREE Resource
1 Slide • 34 Questions
1
2
Multiple Choice
3
Multiple Choice
4
Multiple Choice
5
Multiple Choice
6
Multiple Choice
7
Multiple Choice
8
Multiple Choice
9
Multiple Choice
10
Multiple Choice
11
Multiple Choice
12
Multiple Choice
13
Multiple Choice
14
Multiple Choice
15
Multiple Choice

16
Multiple Choice
17
Multiple Choice

18
Multiple Choice

19
Multiple Choice

During which segment did the car come to a complete stop?
20
Multiple Choice
During which segment did the car travel the fastest?
21
Multiple Choice
22
Multiple Choice
23
Multiple Choice

24
Multiple Choice

25
Multiple Choice
26
Multiple Choice
27
Multiple Choice
28
Multiple Choice

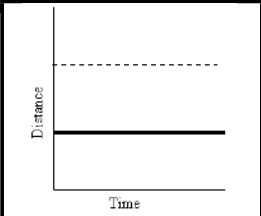
The speed of a bus in this graph is:
29
Multiple Choice

Segment C-D The bus is _________________.
30
Multiple Choice
Segment A-B The bus is _________________.
31
Multiple Choice

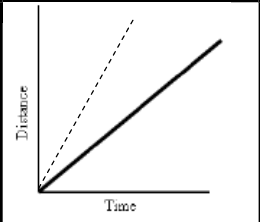
Which is faster?
32
Multiple Choice

What is the total distance the object traveled?
33
Multiple Choice
34
Multiple Choice

What is the speed of the car during line A?
35
Multiple Choice

Show answer
Auto Play
Slide 1 / 35
SLIDE
