Search Header Logo
  1. Resource Library
  2. Math
  3. Data And Graphing
  4. Stem And Leaf Plot
  5. Stem And Leaf Plots And Line Plots
Stem-and-Leaf Plots and Line Plots

Stem-and-Leaf Plots and Line Plots

Assessment

Presentation

Mathematics

7th Grade

Medium

CCSS
6.SP.B.4, 2.MD.D.9, 3.MD.B.4

+2

Standards-aligned

Created by

Jopie Ferrer

Used 25+ times

FREE Resource

11 Slides • 19 Questions

1

Stem-and-Leaf Plots and Line Plots

2

Frequency Table

Learning Objective:

Learn to organize and interpret data in frequency tables and stem-and-leaf plots, and line plots.

3

Frequency Table

Vocabulary:

stem-and-leaf plots

line plots

4

media

5

media

6

media

7

media

8

media

9

media

10

media

11

media

12

Multiple Choice

Question image
How many students had more than 6 candy bars?
1

5

2

2

3

3

4

1

13

Multiple Choice

Question image
How many people had 3 pets?
1

5

2

7

3

4

4

3

14

Multiple Choice

Question image
How many students received a score in the 80's?
1

2

2

10

3

14

4

27

15

Multiple Choice

Question image
What is the highest score in the class?
1

88%

2

100%

3

13

4

98%

16

Multiple Choice

Question image
How many students scored 93% or less?
1

6

2

16

3

14

4

13

17

Multiple Choice

Question image
How many total students are in the science class?
1

13

2

6

3

27

4

25

18

Multiple Choice

Question image

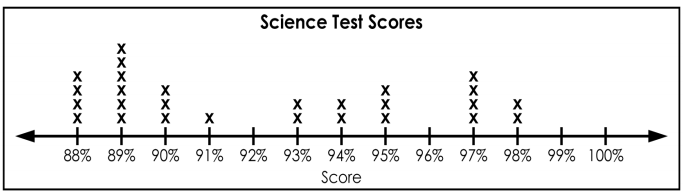
How many more students scored a 88 than scored a 98?

1

4

2

2

3

6

4

10

19

Multiple Choice

Question image

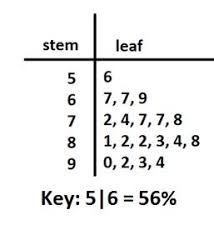
What is the smallest dog's weight?

(Use the stem and leaf plot.)

1

1

2

40

3

13

4

0

20

Multiple Choice

Question image

How many dogs weighed 44 Pounds?

(Use the stem and leaf plot.)

1

2

2

5

3

0

4

11

21

Multiple Choice

Question image

How many dogs weighed 90 Pounds?

(Use the stem and leaf plot.)

1

2

2

1

3

0

4

11

22

Multiple Choice

Question image

How many dogs weighed more than 80 pounds?

(Use the stem and leaf plot.)

1

2

2

1

3

0

4

5

23

Multiple Choice

Question image

How many dogs weighed 60 Pounds?

(Use the stem and leaf plot.)

1

2

2

1

3

0

4

5

24

Multiple Choice

Question image

How many dogs weighed less than 50 lbs?

(Use the stem and leaf plot.)

1

2

2

1

3

0

4

5

25

Multiple Choice

Question image

What was the dog with the biggest weight?

(Use the stem and leaf plot.)

1

89

2

90

3

17

4

1

26

Multiple Choice

Question image

How many dogs weigh 82 lbs?

(Use the stem and leaf plot.)

1

0

2

2

3

82

4

1

27

Multiple Choice

Question image

Which data set goes with this stem-and-leaf plot?

1

41, 52, 57, 58, 65, 66, 70, 75, 78, 78, 78, 80,

80, 95

2

41, 52, 56, 58, 66, 70, 75, 78, 78, 78, 80, 80,

95, 56

3

41, 52, 57, 58, 65, 66, 70, 75, 78, 78, 78, 78,

80, 80

4

52, 52, 57, 58, 65, 66, 70, 75, 78, 78, 78, 80,

80, 95

28

Multiple Choice

Question image

What is the range of heights?

1

24

2

45

3

13

4

26

29

Multiple Choice

Question image

This plot show the ages of people at a birthday party. How many people at the party are 20 years of age or younger ?

1

7

2

6

3

8

4

5

30

Multiple Choice

Question image

This plot show the math test scores of Ms. Lasley's class. How many students score 70% or higher?

1

13

2

15

3

12

4

14

Stem-and-Leaf Plots and Line Plots

Show answer

Auto Play

Slide 1 / 30

SLIDE