Search Header Logo
6a and 7 - FAST d2 -Appropriate Measures of Center and Variation

6a and 7 - FAST d2 -Appropriate Measures of Center and Variation

Assessment

Presentation

Mathematics

6th - 8th Grade

Medium

Created by

Jacob Siedell

Used 4+ times

FREE Resource

3 Slides • 9 Questions

1

media

2

Multiple Select

Select the (2) measures of CENTER.

1

Mean

2

Median

3

IQR

4

Range

3

Multiple Select

Select the (2) measures of VARIABILITY.

1

Mean

2

Median

3

IQR

4

Range

4

​Remember!

Mean and Range ARE affected by outliers and therefore are not great choices when outliers are present.

​Median and IQR ARE NOT affected by outliers as much and therefore are a better choice when outliers are present.

5

Multiple Select

Which measurements would represent the BEST measures of center & variability for the data set shown?

26, 29, 24, 33, 31, 43, 17, 84, 23, 27, 29

1

Mean

2

Median

3

IQR

4

Range

6

Multiple Select

Which measurements would represent the BEST measures of center & variability for the data set shown?

8, 7, 6, 5, 4, 4, 3, 2, 9, 7

1

Mean

2

Median

3

IQR

4

Range

7

Drag and Drop

Question image
For this data set, the​
is the best measure of center and the​
is the better measure of variation.
Drag these tiles and drop them in the correct blank above
median
IQR
range
mean
mode

8

Multiple Select

Question image

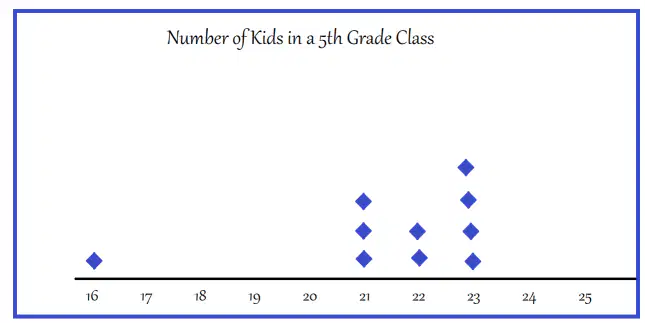
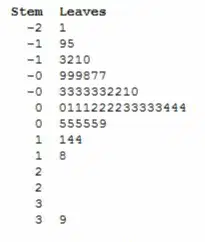
Study the graph and determine one measure of center and one measure of variability that would best describe the data. (hint: are there outliers?)

1

Range

2

Median

3

Mean

4

IQR

9

Multiple Select

Question image

Study the graph and determine one measure of center and one measure of variability that would best describe the data. (hint: are there outliers?)

1

Range

2

Median

3

Mean

4

IQR

10

Multiple Select

Question image

Study the graph and determine one measure of center and one measure of variability that would best describe the data. (hint: are there outliers?)

1

Range

2

Median

3

Mean

4

IQR

11

Multiple Select

Question image

Study the graph and determine one measure of center and one measure of variability that would best describe the data. (hint: are there outliers?)

1

Range

2

Median

3

Mean

4

IQR

12

media

Show answer

Auto Play

Slide 1 / 12

SLIDE