Search Header Logo
7th STAAR Review - Data

7th STAAR Review - Data

Assessment

Presentation

Mathematics

7th Grade

Medium

CCSS
6.SP.B.4, 6.SP.B.5C, HSS.ID.A.3

+3

Standards-aligned

Created by

Jeelisa Shennar

Used 5+ times

FREE Resource

14 Slides • 24 Questions

1

STAAR Review - Data

Mean

Median

Mode

Range

Dot Plots

Circle Graphs

Bar Graphs

Box plots

media

2

media

3

Fill in the Blank

Find the mean of the data set:

7, 8, 3, 4, 8

4

Multiple Choice

Find the mean of the numbers below:


4, 9, 7, 10, 5

1

5

2

6

3

7

4

8

5

media

6

Fill in the Blank

Find the median in the data set:

7, 8, 3, 4, 8

7

Fill in the Blank

Find the median of in the data set:

2, 9, 7, 4, 6, 1

8

media

9

Fill in the Blank

Find the mode in the data set:

7, 8, 3, 4, 8

10

Multiple Choice

The scores awarded to 25 students for an assignment were as follows:

4  7  5  9  8  6  7  7  8  5  6  9  8 5  8  7  4  7  3  6  8  9  7  6  9

What is the mode?

1

6

2

7

3

8

4

9

11

media

12

Multiple Choice

Find the range of the data.

63, 71, 65, 66, 87, 53

1

32

2

33

3

34

4

35

13

Fill in the Blank

Find the range in the data set:

7, 8, 3, 4, 8

14

Analyzing Bar Graphs

media

15

media

16

Multiple Choice

Question image

Based on the graph, what percent of the books checked out was adventure or science fiction?

(Hint: Each line increases by 7)

1

50%

2

62.5%

3

75%

4

80%

17

Multiple Choice

Question image

What percent of the tiles are green?

1

12

2

24

3

50

4

86

18

Circle Graphs

media

19

Draw

If there are 300 seventh graders, how many students prefer choir?

20

Multiple Choice

Question image

There are 200 vegetable plants in a garden. How many of the vegetable plants are green beans?

1

16

2

24

3

28

4

32

21

Multiple Choice

Question image
The team scored 50 points. How many points did Kendrick score?
1

12 points

2

20 points

3

10 points

4

72 points

22

media

Dot Plots

23

media

24

Multiple Choice

Question image
How many students had more than 6 candy bars?
1

5

2

2

3

3

4

1

25

Multiple Choice

Question image
How many total students are in the science class?
1

13

2

6

3

27

4

25

26

Comparing Dot Plots

27

Draw

The mode of the data for Student 1 is ____ the mode of the data for student 2

28

Multiple Choice

Question image

The median of the data for student 2 is ____ the median of the data for Student 1

1

Greater Than

2

Less Than

3

Equal To

29

Multiple Choice

Question image

The dot plots show the number of miles Ben and Barbara ran in the month of February.

Which statement is best supported by the information in the dot plots?

1

The mode of the number of miles ran by Barbara is greater than the mode number of miles ran by Ben.

2

The least number of miles ran by Ben is greater than the least number of miles ran by Barbara

3

The range of the number of miles ran by Barbara is greater than the range of he number of the miles ran by Ben

4

The distribution of the data is approximately symmetical in both sets of data.

30

Box plots

media

31

media

Box plots are a way of representing the spread of data.

Some text here about the topic of discussion.

32

Multiple Choice

Question image

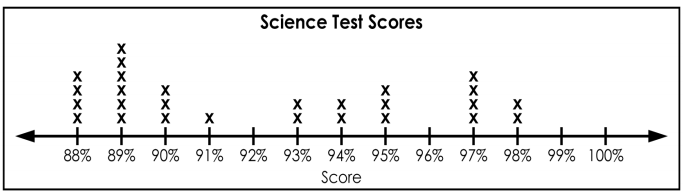
What is the range of math quiz results from Mrs. Sanchez's class?

1

75

2

20

3

95

4

60

33

Multiple Choice

Question image

What is the median of math quiz results from Mrs. Sanchez's class?

1

50

2

63

3

70

4

75

34

Multiple Choice

Question image

What is the interquartile range of these scores?

1

50

2

70

3

40

4

30

35

Comparing Box Plots

36

Draw

Which car club has the higher median?

37

Multiple Choice

Question image

Which car has the biggest maximum jump?

1

Car A

2

Car B

38

Multiple Choice

Question image

Which has a greater interquartile range?

1

Airplane A

2

Airplane B

3

Both the same

STAAR Review - Data

Mean

Median

Mode

Range

Dot Plots

Circle Graphs

Bar Graphs

Box plots

media

Show answer

Auto Play

Slide 1 / 38

SLIDE