
chapter 13 math G7
Presentation
•
•
Practice Problem
•
Hard
Snnana -
FREE Resource
1 Slide • 191 Questions
1
Multiple Choice
2
Multiple Choice
3
Multiple Choice
4
Multiple Choice
5
Multiple Choice
6
Multiple Choice
7
Multiple Choice
8
Multiple Choice
0, 89, 92, 97, 99, 100
9
Multiple Choice
Find the median: 12, 15, 13, 18, 23, 5?
14
16
16.5
18
10
Multiple Choice
What is the mode in the following numbers? [3, 24, 3, 7, 30, 1, 3, 7, 3]
3 and 7 both are modes
1 and 7 both are modes
3 only
7 only
11
Multiple Choice
What is the mean of a data set?
The middle number
The sum of the numbers divided by the number of numbers
The number that occurs the most often
The distance from the smallest to the largest number
12
Multiple Choice
Casandra counted the M&M's in 7 different bags and found the following number of M&M's in each bag:
5, 3, 2, 6, 5, 2, 5
What is the mean number of candies in a bag?
4 M&M's
5 M&M's
3 M&M's
2 M&M's
13
Multiple Choice
What is the FIRST thing you should do when finding the median?
Find the middle number
Add up the digits
Order from least to greatest.
Subtract the smallest from the largest
14
Multiple Choice
Ford measured the gas mileage in one of their pickups. They found the following data.
24, 12, 10, 15, 10, 22, 12
What is the median miles per gallon for the pickup?
13 MPG
14 MPG
15 MPG
12 MPG
15
Multiple Choice
Mr. E has 17 students in his first block, 0 students in his second block, 19 students in his third block, and 18 students in his fourth block. What is the mode for the number of students?
17
17.5
NONE
13.5
16
Multiple Choice
Fredericka scored 75%, 63%, 82%, and 80% on four test. What score does she need on the next test for her average grade to be 78%?
57%
90%
77.5%
12%
17
Multiple Choice
Juan took four 10 point tests and scored an average of 6. If he took a fifth test and scored an 8, how would that affect his mean score?
It would decrease
It would increase
It would remain the same
18
Multiple Choice
Rita is accepting donations. So far she has collected $5, $25, $3, $2, $6, $8, $7, and $5.
Which measure of central tendency best describes the data?
Mean
Median
Mode
Range
19
Multiple Choice
Penelope spent the following hours of time on homework Monday through Friday.
3, 7, 8, and 4.
How many hours would she need to work to have a median of 5 hours spent on homework for the week.
4
3
5
6
20
Multiple Choice
The temperature for a week in July had highs of 76, 84, 83, 91. What will happen to the mean if the temperature the next day is 76?
It will increase by 1.5
It will increase by 3
It will decrease by 1.5
It will decrease by 3
21
Multiple Choice
Grace has 5 cats that are 5, 2, 7, 6, and 3 years old. If she gets a new cat that is 5 years old, how will that effect the median age of the cats?
It will increase by 1
It will decrease by 1
It will stay the same
22
Multiple Choice
Five students were asked about pets at home. The following is their answers:
Dog, Dog, Cat, Fish, Bird, Snail, Dog
Which measure of central tendency best describes the data?
Mean
Median
Mode
Range
23
Multiple Choice
In 2019 the following number of babies were born in the Emerald City each month:
12, 35, 18, 17, 13, 27, 12, 18, 27, 33, 15
How many babies need to be born in the last month to have an average of 20 babies born a month?
7
18
13
27
24
Multiple Choice
Bionca has 5 apple trees in her backyard. The trees produced 6, 13, 14, 9 apples. What happens to the median score if the last tree produced 7 apples.
It will increase by 2
It will decrease by 2
It will stay the same
It will increase by 1
25
Multiple Choice
Trey timed himself running the 100 m dash and got the following times in seconds:
9.81, 9.93, 9.91, 10.06, 9.96, 10.04, 9.94.
What time does he need to get an average speed of 9.89 seconds
9.17 seconds
8.74 seconds
9.99 seconds
Not possible
26
Multiple Choice
What happens to the median of the following set of data if 15 is added?
17, 31, 28, 16, 45, 20
It will increase by 4
It will decrease by 4
It will increase by 5
It will decrease by 5
27
Multiple Choice
Mike biked the following miles on various days:
5, 10, 7, 3, 9, 2
How many miles does he need to travel for his median miles biked to be 5 miles?
9 miles
4 miles
6 miles
8 miles
28
Multiple Select
Henry's homework has 5, 7, 12, 10, 13, 5, 10, 11 problems.
What is the mode of problems he is assigned?
5
7
10
12
29
Multiple Choice
Bastian's scores on tests are:
7, 8, 6, 7, 9, 10, 6, 8, 7
What measure best represents this data?
Mean
Median
Mode
Range
30
Multiple Choice
Sam works as an apprentice at the butcher. He is 5'9" and has a medium build. He is 19 years old. What does Sam weigh?
155 lbs
Meat
Vegetables
170 lbs
31
Multiple Choice
What is the range?
The sum of the largest and smallest number
The number in the middle
The difference between the largest and smallest number
The number that appears most often
32
Multiple Choice
What is the median?
The number in the middle when the numbers are in order from least to greatest.
The difference between the largest and smallest number.
The average
The number that appears most often.
33
Multiple Choice
34
Multiple Choice
35
Multiple Choice
36
Multiple Choice
37
Multiple Choice
38
Multiple Choice
The number of miles that Jenna cycled each week for a 7-week period is shown:
36, 42, 28, 52, 48, 36, 31
What is the median number of miles Jenna cycled?
24
39
36
52
39
Multiple Choice
At Donald's Donuts the number of donut holes in a bag can vary. Help Donald find the MODE.
12,10,10,10,13,12,11,13,10
10
12
10 and 12
No Mode
40
Multiple Choice
41
Multiple Choice
How many students scored more than 80%?
10
13
7
15
42
Multiple Choice
43
Multiple Choice
Which amount had the most classes recycle that much paper?
13
21
7
10
44
Multiple Choice
45
Multiple Choice
What is the highest score in the class?
88%
100%
13
98%
46
Multiple Choice
What is the MEAN for this data?
80
1040
13
81
47
Multiple Choice
Find the median
3
4
5
6
48
Multiple Choice
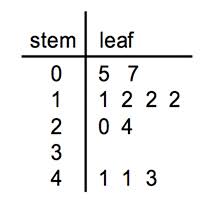
What is the range for the stem and leaf plot? Given 3/2=32
39
40
45
56
49
Multiple Choice
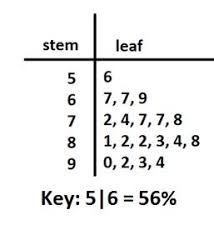
What is the mode for the stem and leaf? Given 5/3=53
66
60
54
25
50
Multiple Choice
What is the mean of the stem and leaf plot? Given 4/8 is 48 inches. Round to the nearest whole number.
63
11
14
55
51
Multiple Choice
Find the Median?
95
97.2
96.8
98
52
Multiple Choice
53
Stem & Leaf Plots
​
54
Multiple Choice
Students recorded how many minutes per hour they used their devices at home.
How many students entered their data on the chart?
18
4
22
10
55
Multiple Choice
How many students used their device for MORE THAN 20 minutes?
10
9
5
13
56
Multiple Choice
What is the difference in minutes between the student who used their device the most in one hour and the student who used their device the least in one hour?
35
2
33
37
57
Multiple Choice
Teachers recorded the number of fidget spinners they saw students using at school in one day. How many teachers saw a fidget spinner?
4
14
18
10
58
Multiple Choice
Two teachers saw the same number of fidget spinners.
How many did they see?
17
10
27
30
59
Multiple Choice
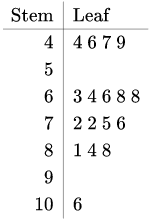
Nick recorded the number of points his basketball team scored during their season in a stem-and-leaf plot. How many games did Nick’s basketball team play?
90
20
10
6
60
Multiple Choice
During how many games did Nick’s team score BETWEEN 55 and 75 points?
3
15
10
13
61
Multiple Choice
During HOW MANY MORE games did Nick’s team score less than 68 points THAN they scored more than 68 points?
11
8
3
19
62
Multiple Choice
63
Multiple Choice
Which data set goes with this stem-and-leaf plot?
41, 52, 57, 58, 65, 66, 70, 75, 78, 78, 78, 80,
80, 95
41, 52, 56, 58, 66, 70, 75, 78, 78, 78, 80, 80,
95, 56
41, 52, 57, 58, 65, 66, 70, 75, 78, 78, 78, 78,
80, 80
52, 52, 57, 58, 65, 66, 70, 75, 78, 78, 78, 80,
80, 95
64
Multiple Choice
This shows how many baseball cards a group of friends have in their collections. How many friends have baseball card collections with more than 70 cards?
7
8
9
4
65
Multiple Choice
This plot show how many point was scored on a video game. What is the difference between the greatest and least amount of point scored?
4.8
3.9
3.8
8.4
66
Multiple Choice
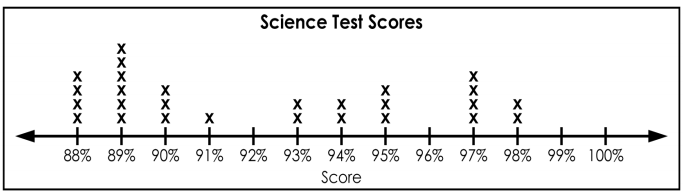
This plot show the math test scores of Ms. Lasley's class. How many students score 70% or higher?
13
15
12
14
67
Multiple Choice
This plot show the ages of people at a birthday party. How many people at the party are 20 years of age or younger ?
7
6
8
5
68
Multiple Choice
Data on a stem-and-leaf plot is listed in what order.
Greatest to Least
Least to Greatest
69
Multiple Choice
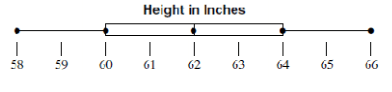
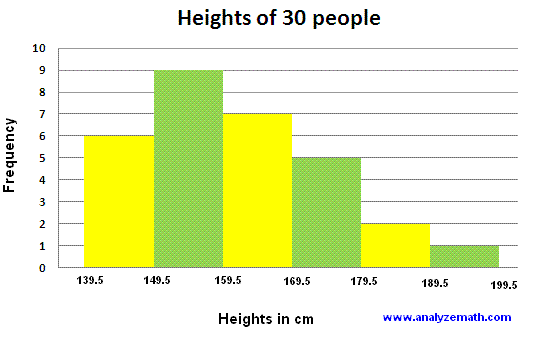
What is the range of heights?
24
45
13
26
70
Multiple Choice
What is the Mode?
97.4
97.2
97
96.8
71
Multiple Choice
How many baseballs were thrown 5.0 or more feet?
5
4
13
8
72
Multiple Choice
These are the test scores for two different classes. Which class has a greater median?
2009 class
2010 class
neither
Same
73
Multiple Choice
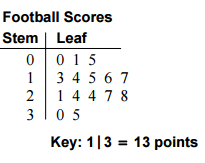
What is the mean (Avg.) for this set of football scores?
15
18
24
17
74
Multiple Choice
75
Multiple Choice
Which of the following is used to describe the distribution of the data?
Outlier
Range
Measures of Variation
Interquartile Range (IQR)
76
Multiple Choice
What 5 items are found when finding the Measures of Variation?
mean, median, mode, range, IQR
median, first quartile, third quartile, range, mode
median, first quartile , third quartile, IQR, range
mode, IQR, range, mean, first quartile
77
Multiple Choice
When finding the median, what is the FIRST step?
Mark off the lowest number
Mark off the highest number
Find the Middle
Arrange the number from Least to Greatest
78
Multiple Choice
How do you find the Interquartile Range?
divide the 3rd quartile (Q3) by the 1st quartile
subtract the biggest number by the smallest number
divide the biggest number by the smallest number
subtract the 3rd quartile (Q3) by the 1st quartile (Q1)
79
Multiple Choice
To find the interquartile range (IQR)...
Q1 - Q3
Q3 - Q2
Q3 - Q1
Q2 - Q1
80
Multiple Choice
Find the Lower Quartile (Q1) of the following numbers:
84, 88, 72, 74, 98, 16, 94
72
88
94
There is no Lower Quartile.
81
Multiple Choice
Find the Upper Quartile (Q3) of the following numbers:
84, 88, 72, 74, 98, 16, 94
72
88
94
There is no Upper Quartile.
82
Multiple Choice
84, 88, 72, 74, 98, 16, 94
83
Multiple Choice
Find the 1st (Q1) , 2nd (Median), and 3rd (Q3) quartile of the data set:
4, 2, 1, 3, 13, 7, 11,15
1st: 3, 2nd: 6, 3rd: 14
1st: 13, 2nd: 5.5, 3rd: 2.5
1st: 2.5, 2nd: 5.5, 3rd: 12
1st: 14, 2nd: 6, 3rd: 3
84
Multiple Choice
What is the IQR of this data set?
37, 42, 48, 51, 52, 53, 54, 54, 55
5
6
8
9
85
Multiple Choice
86
Multiple Choice
87
Multiple Choice
88
Multiple Choice
89
Multiple Choice
2, 5, 8, 3, 13, 5
90
Multiple Choice
91
Multiple Choice
92
Multiple Choice
What is the IQR?
9
3
1
2
1.5
93
Multiple Choice
The first thing we do when we find the median is...
add and divide
nothing
subtract each number
order from least to greatest
94
Multiple Choice
The table shows the points earned by contestants in a competition. Find the range and the interquartile range of the points.
Range: 15
IQR: 10
Range: 15
IQR: 11
Range: 15
IQR: 12
Range: 15
IQR: 13
95
Multiple Choice
96
Multiple Choice
97
Multiple Choice
98
Multiple Choice
What percent of the data is less than 14?
75%
50%
25%
Not enough information to tell.
99
Multiple Choice
What percent of the data is between 58 and 62 inches?
25%
75%
50%
100%
100
Multiple Choice
find the lower quartile of the following set of scores
12, 9, 4, 6, 5, 8, 9, 4, 10, 2
101
Multiple Choice
The box-and-whisker plots show the points scored in each Super Bowl by the AFC and NFC. About how many points higher is the third quartile for the NFC than the third quartile for the AFC?
5 points
7 points
10 points
15 points
102
Multiple Choice
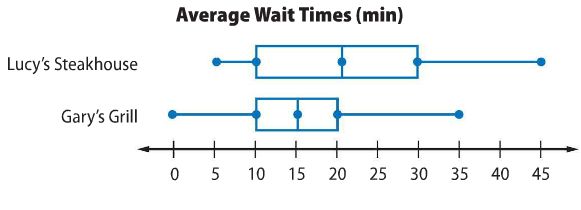
The double dot plots show the average wait times in minutes for two popular rides at an amusement park. Which ride has a greater range of wait times?
No determination can be made from the graph.
Topsy Turvy
The range in wait times are the same for both rides.
Rocket Blast
103
Multiple Choice
Find the median (Q2) of the following numbers:
84, 88, 72, 74, 98, 16, 94
72
88
84
79
104
Multiple Choice
Which box and whisker plot has the smaller median?
Top plot
Bottom plot
105
Multiple Choice
106
Multiple Choice
What percent of women in the conservation club are between the ages of 26 and 42?
50%
75%
100%
25%
107
Multiple Choice
Use the box-and-whisker plots to determine if this statement is true. The interquartile range (IQR) of the men’s ages is greater than the interquartile range of the women’s ages.
True
False
108
Multiple Choice
A
B
C
D
109
Multiple Choice
110
Multiple Choice
111
Multiple Choice
112
Multiple Choice
How do you calculate the IQR (interquartile range) ?
Q2 - Q1
Q1 - Q3
Q3 - Q2
Q3 - Q1
113
Multiple Choice
What is the interquartile range of these scores?
50
70
40
30
114
Multiple Choice
Minimum: 1
Q1: 3
Median: 5
Q3: 7
Maximum: 9
115
Fill in the Blanks
Type answer...
116
Fill in the Blanks
Type answer...
117
Fill in the Blanks
Type answer...
118
Multiple Choice
What do points B and D represent on the box plot?
Mean and Mode
Mean and Median
Least and Greatest Value
First and Third Quartiles
119
Multiple Choice
120
Multiple Choice
What amount of cupcakes makes up the middle 50% of the data?
16-22 cupcakes
12-32 cupcakes
22-28 cupcakes
16-28 cupcakes
121
Multiple Choice
What amount of cupcakes makes up the lower 25% of the data?
16-22 cupcakes
12-16 cupcakes
22-28 cupcakes
28-32 cupcakes
122
Dropdown
The IQR of the Cruisers is
The IQR of the Car Hops is
123
Fill in the Blanks
Type answer...
124
Multiple Choice
What is the third quartile of the data?
125
Multiple Choice
Based on the box plot, which of the following is not true?
126
Multiple Choice
Based on the information in the box plots, which statement appears to be true?
The median amount of time spent studying by the girls was less than the median amount of time spent studying by the boys.
The range for the girls was 5 minutes more than the range for the boys.
The interquartile range for the boys was less than the interquartile range for the girls.
The minimum amount of time the boys spent studying was greater than the minimum amount of time the girls spent studying.
127
Multiple Choice
128
Multiple Choice
Approximately 1/4 of the finishing times were in the interval 20–22 minutes.
Approximately 25% of the finishing times were greater than 28 minutes.
Approximately 50% of the finishing times were less than 25 minutes.
The range for the data is 5.
129
Multiple Choice
130
Multiple Choice
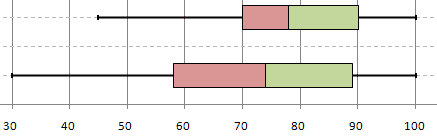
The box-and-whisker plots shown below represent the salaries of employees at two different
companies.
What is the difference between the median salaries of the employees at the two companies?
$0
$500
$1000
$2000
131
Multiple Choice
132
Multiple Choice
Which statement best describes the data represented in the box plot?
F
G
H
J
133
Multiple Choice
f
g
h
j
134
Multiple Choice
HInt: Which is FALSE?
The data for Sophie’s Café is more symmetrical than the data for The Red Brick Grill.
The median prices are the same for The Red Brick Grill and Sophie’s Café.
The maximum lunch price is less at Sophie’s Café than The Red Brick Grill.
The interquartile range for The Red Brick Grill is equal to the interquartile range for Sophie’s Café.
135
Multiple Select
Which statements are true. Select three correct statements.
Howard County Little League has 50% of its data above 150 pitches and Wayne County Little League has 25% of its data above 150 pitches.
Wayne County Little League has 50% of its data above 150 pitches and Howard Little League has 25% of its data above 150 pitches.
Wayne County Little League has a higher lower quartile than Howard County Little League.
Howard County Little League has a larger range the Wayne County Little League.
The Interquartile Range for Wayne County is smaller than the Interquartile Range for Howard County.
136
Multiple Choice
F
G
H
J
137
Multiple Choice
A
B
C
D
138
Multiple Choice
139
Multiple Choice
140
Multiple Choice
141
Multiple Choice
142
Multiple Choice
143
Multiple Choice
144
Multiple Choice
145
Multiple Choice
146
Multiple Choice
147
Multiple Choice
148
Multiple Choice
149
Multiple Choice
Which interval has the greatest number of students?
150
Multiple Choice
151
Multiple Choice
152
Multiple Choice
153
Multiple Choice
154
Multiple Choice
155
Multiple Choice
156
Multiple Choice
157
Multiple Choice
158
Multiple Choice
159
Multiple Choice
160
Multiple Choice
161
Multiple Choice
162
Multiple Choice
163
Multiple Choice
164
Multiple Choice
165
Multiple Choice
166
Multiple Choice
167
Multiple Choice
168
Multiple Choice
169
Multiple Choice
170
Multiple Choice
171
Multiple Choice
172
Multiple Choice
173
Multiple Choice
174
Multiple Choice
175
Multiple Choice
176
Multiple Choice
177
Multiple Choice
How many students have 2 Brothers and Sisters?
4 students
7 students
0 students
3 student
178
Multiple Choice
179
Multiple Choice
180
Multiple Choice
181
Multiple Choice
3, 5, 2, 5, 4, 7, 1, 0, 6, 4, 8, 5, 3, 2, 4, 5, 9.
How many times were 6-8 goals scored?
182
Multiple Choice
183
Multiple Choice
184
Multiple Choice
185
Multiple Choice
186
Multiple Choice
187
Multiple Choice
188
Multiple Choice
189
Multiple Choice
190
Multiple Choice
191
Multiple Choice
192
Multiple Choice
Show answer
Auto Play
Slide 1 / 192
MULTIPLE CHOICE
Similar Resources on Wayground
182 questions
VEX Push Back Overview
Presentation
•
9th - 12th Grade
190 questions
Kelas 6 SDN 014 SIALANG KAYU BATU
Presentation
•
6th Grade
193 questions
AJ Overtime
Presentation
•
5th - 8th Grade
187 questions
Unit 2.1 only
Presentation
•
10th Grade
179 questions
Spanish I Review
Presentation
•
8th Grade
188 questions
fisssiologi
Presentation
•
University
185 questions
STAAR Grammar review
Presentation
•
KG - University
184 questions
P&D 2014-15
Presentation
•
KG - University
Popular Resources on Wayground
20 questions
"What is the question asking??" Grades 3-5
Quiz
•
1st - 5th Grade
20 questions
“What is the question asking??” Grades 6-8
Quiz
•
6th - 8th Grade
10 questions
Fire Safety Quiz
Quiz
•
12th Grade
20 questions
Equivalent Fractions
Quiz
•
3rd Grade
34 questions
STAAR Review 6th - 8th grade Reading Part 1
Quiz
•
6th - 8th Grade
20 questions
“What is the question asking??” English I-II
Quiz
•
9th - 12th Grade
20 questions
Main Idea and Details
Quiz
•
5th Grade
47 questions
8th Grade Reading STAAR Ultimate Review!
Quiz
•
8th Grade
Discover more resources for
11 questions
Positive Relationships
Presentation
•
KG
19 questions
Fire Safety
Quiz
•
KG - 2nd Grade
36 questions
8th Grade US History STAAR Review
Quiz
•
KG - University
20 questions
Capitalization in sentences
Quiz
•
KG - 4th Grade
25 questions
5th Grade Science STAAR Review
Quiz
•
KG - University
10 questions
Counting Nickels and Pennies
Quiz
•
KG - 2nd Grade
16 questions
Parallel, Perpendicular, and Intersecting Lines
Quiz
•
KG - Professional Dev...
13 questions
Time
Quiz
•
KG - 2nd Grade