
chapter 13 math G7
Presentation
•
Mathematics
•
6th - 8th Grade
•
Practice Problem
•
Easy

Snnana -
Used 1+ times
FREE Resource
4 Slides • 202 Questions
1
Multiple Choice
2
Multiple Choice
3
Multiple Choice
4
Multiple Choice
5
Multiple Choice
6
Multiple Choice
7
Multiple Choice
8
Multiple Choice
9
Multiple Choice
10
Multiple Choice
11
Multiple Choice

Dr. Dre is a dentist. He needs to report on the average (Mean) number of cavities that his patients have.
1, 0, 1, 5, 0, 3, 4. What is the average number of cavities?
12
Multiple Choice

At Donald's Donuts the number of donut holes in a bag can vary. Help Donald find the MODE.
12,10,10,10,13,12,11,13,10
13
Multiple Choice
14
Multiple Choice
15
Multiple Choice
16
Multiple Choice
17
Multiple Choice
18
Multiple Choice
19
Multiple Choice
20
Multiple Choice
21
Multiple Choice
22
Multiple Choice
23
Multiple Choice
24
Multiple Choice
25
Multiple Choice
26
Multiple Choice
27
Multiple Choice
28
Multiple Choice
29
Multiple Choice
30
Multiple Choice
31
Multiple Choice
32
Multiple Choice
33
Multiple Choice
34
Multiple Choice
35
Multiple Choice
36
Multiple Choice
37
Multiple Choice
38
Multiple Select
39
Multiple Choice
40
Multiple Choice
41
Multiple Choice

42
Multiple Choice

43
Multiple Choice
44
Multiple Choice

45
Multiple Choice

46
Multiple Choice
47
Multiple Choice
48
Multiple Choice
49
Multiple Choice
50
Multiple Choice
51
Multiple Choice

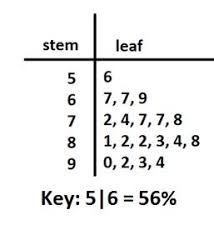
How many students scored more than 80%?
52
Multiple Choice

53
Multiple Choice

Which amount had the most classes recycle that much paper?
54
Multiple Choice
55
Multiple Choice

What is the highest score in the class?
56
Multiple Choice

What is the MEAN for this data?
57
Multiple Choice

Find the median
58
Multiple Choice

What is the range for the stem and leaf plot? Given 3/2=32
59
Multiple Choice

What is the mode for the stem and leaf? Given 5/3=53
60
Multiple Choice

What is the mean of the stem and leaf plot? Given 4/8 is 48 inches. Round to the nearest whole number.
61
Multiple Choice

Find the Median?
62
Multiple Choice

63
Multiple Choice
64
Multiple Choice

Which data set goes with this stem-and-leaf plot?
65
Multiple Choice
This shows how many baseball cards a group of friends have in their collections. How many friends have baseball card collections with more than 70 cards?
66
Multiple Choice

This plot show how many point was scored on a video game. What is the difference between the greatest and least amount of point scored?
67
Multiple Choice
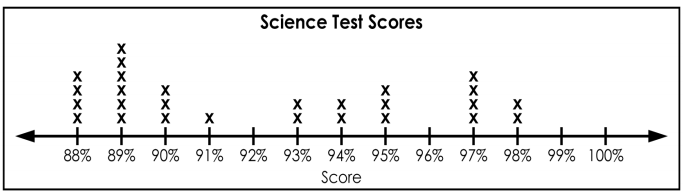
This plot show the math test scores of Ms. Lasley's class. How many students score 70% or higher?
68
Multiple Choice
This plot show the ages of people at a birthday party. How many people at the party are 20 years of age or younger ?
69
Multiple Select
70
Multiple Choice
71
Multiple Choice
72
Multiple Choice

What is the range of heights?
73
Multiple Choice

What is the Mode?
74
Multiple Choice

How many baseballs were thrown 5.0 or more feet?
75
Multiple Choice

These are the test scores for two different classes. Which class has a greater median?
76
Multiple Choice

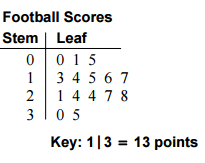
What is the mean (Avg.) for this set of football scores?
77
Multiple Choice
78
Multiple Choice
79
Multiple Choice
80
Multiple Choice
81
Multiple Choice
82
Multiple Choice
83
Multiple Choice
84
Multiple Choice
85
Multiple Choice
86
Multiple Choice
87
Multiple Choice
88
Multiple Choice
89
Multiple Choice
90
Multiple Choice
91
Multiple Choice
92
Multiple Choice
At Donald's Donuts the number of donut holes in a bag can vary. Help Donald find the mode.
12,10,10,10,13,12,11,13,10
93
Multiple Choice
94
Multiple Choice
95
Multiple Choice
96
Multiple Choice
97
Multiple Choice
98
Multiple Choice
99
Multiple Choice

Which dot plot shows more consistency? a or b?
100
Multiple Choice
101
Multiple Choice
102
Multiple Choice
103
Multiple Choice

What is the IQR?
104
Multiple Choice

Which car club has the higher median?
105
Multiple Choice

What data value is the upper quartile (Q3)?
106
Multiple Choice

Which club has the smaller spread?
107
Multiple Choice

75% of the Cruisers went to more than 13 car shows. True or False?
108
Multiple Choice

The table shows the points earned by contestants in a competition. Find the range and the interquartile range of the points.
109
Multiple Choice
110
Multiple Choice
What percent of the data is less than 14?
111
Multiple Choice
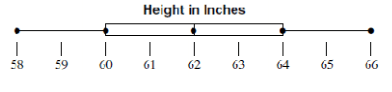
What percent of the data is between 58 and 62 inches?
112
Multiple Choice
113
Multiple Choice
114
Multiple Choice
115
Multiple Choice

Use the box-and-whisker plots to determine if this statement is true:
25% of men in the car club are 34 or older.
116
Multiple Choice

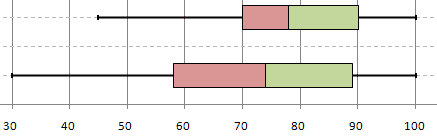
The box-and-whisker plots show the points scored in each Super Bowl by the AFC and NFC. About how many points higher is the third quartile for the NFC than the third quartile for the AFC?
117
Multiple Choice

The double dot plots show the average wait times in minutes for two popular rides at an amusement park. Which ride has a greater range of wait times?
118
Multiple Choice
119
Multiple Choice
120
Multiple Choice

121
Multiple Choice

Which box and whisker plot has the smaller median?
122
Multiple Choice

123
Multiple Choice
Use the box-and-whisker plots to determine if this statement is true. The interquartile range (IQR) of the men’s ages is greater than the interquartile range of the women’s ages.
124
Multiple Choice
What percent of women in the conservation club are between the ages of 26 and 42?
125

126

127
Multiple Choice

128
Multiple Choice
129
Multiple Choice

130
Multiple Choice
131
Multiple Choice
132
Multiple Choice
133
Multiple Choice
134
Multiple Choice
135
Multiple Choice

What is the value of the lower quartile (Q1)?
136
Multiple Choice

137
Multiple Choice

What is the least and greatest value of this data set?
138
Multiple Choice
What is the median of this data set?
139
Multiple Choice

What does point C on the box plot represent?
140

141
Multiple Choice
What is the range of this data set?
142
Multiple Choice

143
Multiple Choice

144
Multiple Choice
145
Multiple Choice
146
Multiple Choice
What is the range of this data set?
147

148
Multiple Choice

What percent of students have heights between 60 inches and 66 inches?
149
Multiple Choice

150
Multiple Choice

151
Multiple Choice

152
Multiple Choice
What does point C on the box plot represent?
153
Multiple Choice

What do points B and D represent on the box plot?
154
Multiple Choice
What do points A and E represent on the box plot?
155
Multiple Choice
What is the median of this data set?
156
Multiple Choice
What is the least and greatest value of this data set?
157
Multiple Choice
What is the range of this data set?
158
Multiple Choice
Data points in the first quartile are between which two points?
159
Multiple Choice
160
Multiple Choice
161
Multiple Choice
162
Multiple Choice

163
Multiple Choice
164
Multiple Choice
165
Multiple Choice
166
Multiple Choice
167
Multiple Choice

168
Multiple Choice

Long High School has kept a record of how many students have enrolled in Algebra1 over the last 40 years.
Based on the data, the enrollment for Algebra 1 over the next ten years will most likely---
169
Multiple Choice

How many students owned less than 10 pets?
170
Multiple Choice
171
Multiple Choice

Which interval shows the least number of pets?
172
Multiple Choice

How many students were 50 inches tall or taller?
173
Multiple Choice

How many students were between 55 and 59 inches tall?
174
Multiple Choice

Random lawyers were surveyed on their yearly salary. The results were recorded in the graph.
Jane wants to be a lawyer when she grows up. Which yearly salary could she most likely expect?
175
Multiple Choice
176
Multiple Choice

177
Multiple Choice

178
Multiple Choice

179
Multiple Choice

The histogram shows the number of fish found at a certain depth of water on a fishing trip.
If a circle graph was used to display the same information, what percentage of the circle graph would show the number of fish at the depth of 40 to 79 feet?
(hint: )
180
Multiple Choice

181
Multiple Choice

182
Multiple Choice

183
Multiple Choice

184
Multiple Choice

185
Multiple Choice
186
Multiple Choice
187
Multiple Choice

188
Multiple Choice

189
Multiple Choice

190
Multiple Choice
191
Multiple Choice

192
Multiple Choice

193
Multiple Choice

194
Multiple Choice

195
Multiple Choice

196
Multiple Choice

197
Multiple Choice

198
Multiple Choice

199
Multiple Choice

200
Multiple Choice

201
Multiple Choice

202
Multiple Choice

203
Multiple Choice

204
Multiple Choice

Which interval has the greatest number of students?
205
Multiple Choice
206
Multiple Choice
How many students were greater than or equal to 60 inches tall?
Show answer
Auto Play
Slide 1 / 206
MULTIPLE CHOICE
