
M1 1.11
Presentation
•
Mathematics
•
9th Grade
•
Practice Problem
•
Medium

Jim Cross
Used 2+ times
FREE Resource
19 Slides • 36 Questions
1
Using Desmos for Statistics

When given a list of numbers and asked to find various statistics.
Start by going to Desmos and creating a list and giving it a name.
To the right, I have created to data lists and called them A and B.
Make sure to use the
"corner brackets" L = [ , , , , ]
and seperate the numbers with comas.
2
Using Desmos for Statistics
After you have created a list in Desmos, you need to tell Desmos what to do with those numbers.
stats( ) will give you the 5 number summary. Minimun, Q1, Median, Q3 and Max
I have found the 5 number summary for both the lists A and B

3
Fill in the Blanks
4
Using Desmos for Statistics
Turn to page 80 in your book.
1.
if you got that question wrong, double check your numbers are in Desmos correctly.
If change any of the numbers that stats numbers will change
Here comes more questions about Resturant A
5
Fill in the Blanks
6
Fill in the Blanks
7
Using Desmos for Statistics
Turn to page 80 in your book.
1.
If you recall the interquartile range or IQR is found by taking
Q3 - Q1
That is what the next question is going to ask you.
you can use Desmos to figure it out, go to an empty line and type in the two numbers with a minus sign between them
8
Fill in the Blanks
9
Using Desmos for Statistics
Turn to page 80 in your book.
1.
Ok now your are going to get questions about restuarant B
make sure you have the 5 number summary written down in your book.
10
Fill in the Blanks
11
Fill in the Blanks
12
Fill in the Blanks
13
Using Desmos for Statistics
Turn to page 80 in your book.
1.
now find the mean of the data from Restaurant A and Restaurant B
remember: mean is written with all small letters.
inside the parentheses should be
the letter of the data list
Write down both A and B's means

14
Multiple Choice
What is the mean for Restaurant A?
87.83
82.33
84.75
82.75
15
Multiple Choice
What is the mean for Restaurant B?
87.83
82.33
84.75
82.75
16
Using Desmos for Statistics
Turn to page 80 in your book.
2. Enter the lists of the two data sets
Find and then write down the mean, median, IQR of each restaurant under #2 in the book
make sure the numbers are in accurately

17
Match
Match the following for the two sets of data about the teachers
8
7.9
2
7
6.4
Teacher A
median
Teacher B
mean
Teacher B
IQR
Teacher A
IQR
Teacher A
mean
Teacher A
median
Teacher B
mean
Teacher B
IQR
Teacher A
IQR
Teacher A
mean
18
Using Desmos for Statistics
Turn to page 80 in your book.
3. Enter the lists of the two station data sets.

do not include the dollar signs
be careful, the comas and decimal points can get confusing.
Take your time
Find and then write down the mean, median, IQR of each station under #3 in the book
19
Using Desmos for Statistics
Turn to page 81 in your book.
1. Enter the list of data on one line is Desmos
on the next line type:
histogram(A)

20
Using Desmos for Statistics
Turn to page 81 in your book.
1. Enter the list of data on one line is Desmos. you can drag the line of the typing area over to the right so you can see all the numbers if you want
on the next line type:
histogram(A)

you should see something like this. click the bin alignment button to be left (not center)
21
Using Desmos for Statistics
Turn to page 81 in your book.
1. Click on the arrows at the top so you can just see the graphing area and you should see the histogram

22
Using Desmos for Statistics
here some reminders about distribution shapes.
bell shaped: most data is in the middle
Skewed most of the data is on one side, the skew is the other side
bimodal : two peaks
uniform: all about the same

23
Multiple Choice
how would you discribe the distribution of the histogram you made in desmos?
skewed to the left
skewed to the right
symmetrical
uniform
24
Multiple Choice
on the hisogram you just graphed in Desmos:
Which interval has the highest frequency?
3-4
1-2
2-3
4-5
25
Using Desmos for Statistics
Turn to page 81 in your book.
2. Create a data set in desmos L=[0,40,60,70,75,80,85,95,95,100]
then find the mean(L) and median(L) and write the down
Now remove the zero from the data set L=[40,60,70,75,80,85,95,95,100]
What happened to the mean and the median. Write it down
26
Multiple Choice
Given the data set L=[0,40,60,70,75,80,85,95,95,100]
What happened to the mean when the 0 was removed from the data set?
mean went up
mean went down
mean stayed the same
27
Multiple Choice
Given the data set L=[0,40,60,70,75,80,85,95,95,100]
What happened to the mdian when the 0 was removed from the data set?
median went up
median went down
median stayed the same
28
Using Desmos for Statistics
Turn to page 81 in your book.
3. Create a data set in desmos L=[2,2,4,4,5,5,6,7,9,15]
Find the 5 number summary
stats(L) Write the numbers down next to a.
What happens to the 5 number summary when the max 15 is removed?
Write down the 5 number summary next to b
What changed?
29
Multiple Select
After finding the 5 number summary for the data set
L=[2,2,4,4,5,5,6,7,9,15]
what happened when the 15 was removed from the data set?
Select all that are true
Q1 changed
Median changed
Q3 changed
Max changed
30
Using Desmos for Statistics
Turn to page 82 in your book.
4. See the histogram in the book
a. how would you describe the distribution?

31
Multiple Select
Fescribe the distribution of the histogram
select all that are true
bimodal
skewed to left
skewed to right
symmetrical
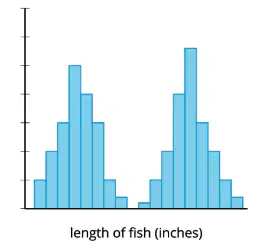
32
Using Desmos for Statistics
Turn to page 82 in your book.
5. Look at the box plot
notice how most of the data is on one side
that one whisker is much longer than the other
The extra stuff away from where most of the data is causing a skew

33
Multiple Choice
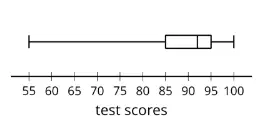
How would you describe the distribution of the box plot
skewed to the left
skewed to the right
symmetrical
uniform
34
Using Desmos for Statistics
Turn to page 82 in your book.
6. skip this question. It is impossible to find the mean or median because we cannot know for sure what the exact numbers of the data are. For a,b,c,d write cant do it
35
Using Desmos for Statistics
Turn to page 83 in your book.
7. Describe the distribution of the histogram. Notice that most of the data is on one side with some extras on the other side.
the extra stuff is causing a skew

36
Multiple Choice
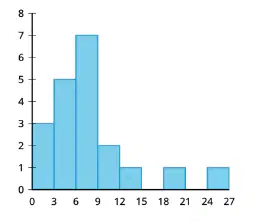
Describe the distribution
skewed to the right
skewed to the left
symmetric
bimodal
37
Using Desmos for Statistics
here some reminders about distribution shapes.
bell shaped: most data is in the middle
Skewed most of the data is on one side, the skew is the other side
bimodal : two peaks
uniform: all about the same
38
Multiple Choice

How is the graph distributed?
Normally
Skewed to the Left
Skewed to the Right
Uniform
39
Multiple Choice

How is the graph distributed?
Normally
Skewed to the Left
Skewed to the Right
Uniform
40
Multiple Choice

Which best describes the shape of the histogram?
uniform
unimodal
bimodal
skewed right
41
Multiple Choice
Which of the numbers below is NOT part of a 5 number summary used to create a boxplot?
minimum
first quartile
mean
third quartile
maximum
42
Multiple Choice

15-19
0-4
5-9
10-14
43
Multiple Choice
ADD the biggest and smallest numbers
Place the number in order from least to greatest then find the middle.
Find the difference between the Maximum and the Minimum.
Find the average.
44
Multiple Choice
ADD the biggest and smallest numbers
Place the number in order from least to greatest then find the middle.
Find the difference between the Maximum and the Minimum.
Subtract Q3 from Q1
45
Multiple Choice
Mean, Median, Mode, Range, and Total
Minimum, Quartile 1, Median, Quartile 3, and Maximum
Smallest, Q1, Q2, Q3, and Q4
Minimum, Maximum, Range, Mean, and Median
46
Multiple Choice

The histogram shows the numbers of transactions made per day at this ATM (cajero), on the last days.
How many days the ATM registered between 80-90 transactions?
8
20
4
450
47
Multiple Choice
The median of a data set can be found by...
subtracting the minimum from the maximum
choosing the middle number
choosing the number that occurs most
finding the sum of the numbers and then dividing by the total amount of numbers in the data set
48
Multiple Choice
The mean of a data set can be found by...
subtracting the minimum from the maximum
choosing the middle number
choosing the number that occurs most
finding the sum of the numbers and then dividing by the total amount of numbers in the data set
49
Multiple Choice

Which has a higher median?
Florida
Texas
50
Multiple Choice

Which has a lower IQR? (Interquartile Range)
Florida
Texas
51
Multiple Choice

Describe the shape of the data.
Symmetrical
Bell shaped
Skewed Left
Skewed Right
Uniform
52
Multiple Select
Which of the following are true about the IQR? Check all that apply.
IQR = Q3 - Q1
IQR = Q1 - Q3
IQR stands for interquartile range
The IQR stands for internal quotient result
53
Multiple Choice

200
100
90
140
54
Multiple Choice

Millersburg
Arcadia
55
Multiple Choice

200
260
220
140
Using Desmos for Statistics
When given a list of numbers and asked to find various statistics.
Start by going to Desmos and creating a list and giving it a name.
To the right, I have created to data lists and called them A and B.
Make sure to use the
"corner brackets" L = [ , , , , ]
and seperate the numbers with comas.
Show answer
Auto Play
Slide 1 / 55
SLIDE
Similar Resources on Wayground

48 questions
Math 1 17 Feb
Presentation
•
9th Grade
47 questions
Matematik F3 Nisbah Trigonometri
Presentation
•
9th Grade
53 questions
Ecology Overview
Presentation
•
9th - 10th Grade
50 questions
Properities of Parallelograms
Presentation
•
8th - 10th Grade
51 questions
PT_9.10 Toleransi 2
Presentation
•
9th Grade
52 questions
Solving Exponential & Logarithmic Equations Lesson Notes
Presentation
•
9th Grade
49 questions
LESSON: Translating Expressions/Equations/Inequalities
Presentation
•
8th Grade
53 questions
Understanding and Writing ECR
Presentation
•
9th Grade
Popular Resources on Wayground
15 questions
Grade 3 Simulation Assessment 1
Quiz
•
3rd Grade
22 questions
HCS Grade 4 Simulation Assessment_1 2526sy
Quiz
•
4th Grade
16 questions
Grade 3 Simulation Assessment 2
Quiz
•
3rd Grade
19 questions
HCS Grade 5 Simulation Assessment_1 2526sy
Quiz
•
5th Grade
17 questions
HCS Grade 4 Simulation Assessment_2 2526sy
Quiz
•
4th Grade
20 questions
Equivalent Fractions
Quiz
•
3rd Grade
24 questions
HCS Grade 5 Simulation Assessment_2 2526sy
Quiz
•
5th Grade
20 questions
Math Review
Quiz
•
3rd Grade
Discover more resources for Mathematics
20 questions
Algebra 1 EOC Review 1
Quiz
•
9th Grade
20 questions
Graphing Inequalities on a Number Line
Quiz
•
6th - 9th Grade
5 questions
A.F/ST Quizizz Day 1
Quiz
•
9th - 12th Grade
5 questions
G.PC/DF Quizizz Day 2
Quiz
•
9th - 12th Grade
5 questions
A.F/ST Quizizz Day 5
Quiz
•
9th - 12th Grade
15 questions
Combine Like Terms and Distributive Property
Quiz
•
8th - 9th Grade
15 questions
Algebra 1 EOC Review #1
Quiz
•
9th Grade
5 questions
A.F/ST Quizizz Day 3
Quiz
•
9th - 12th Grade